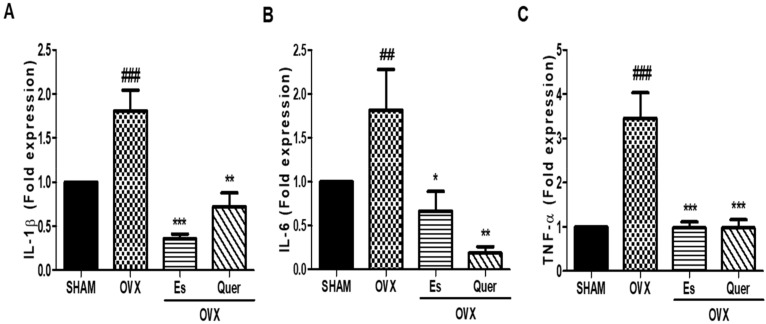
Figure 3.
Effect of quercitrin on liver inflammatory cytokines in OVX mice. Total mRNA levels in liver tissues from each group were quantified through real-time PCR. Relative expression levels of (A) IL-1β; (B) IL-6; and (C) TNF-α, were determined and normalized to those of glyceraldehyde 3-phosphate dehydrogenase (GAPDH). All values are expressed as mean ± SEM. ## p < 0.01 and ### p < 0.001 vs. control group. * p < 0.05, ** p < 0.01, and *** p < 0.001 vs. OVX group (N = 10 per group).

