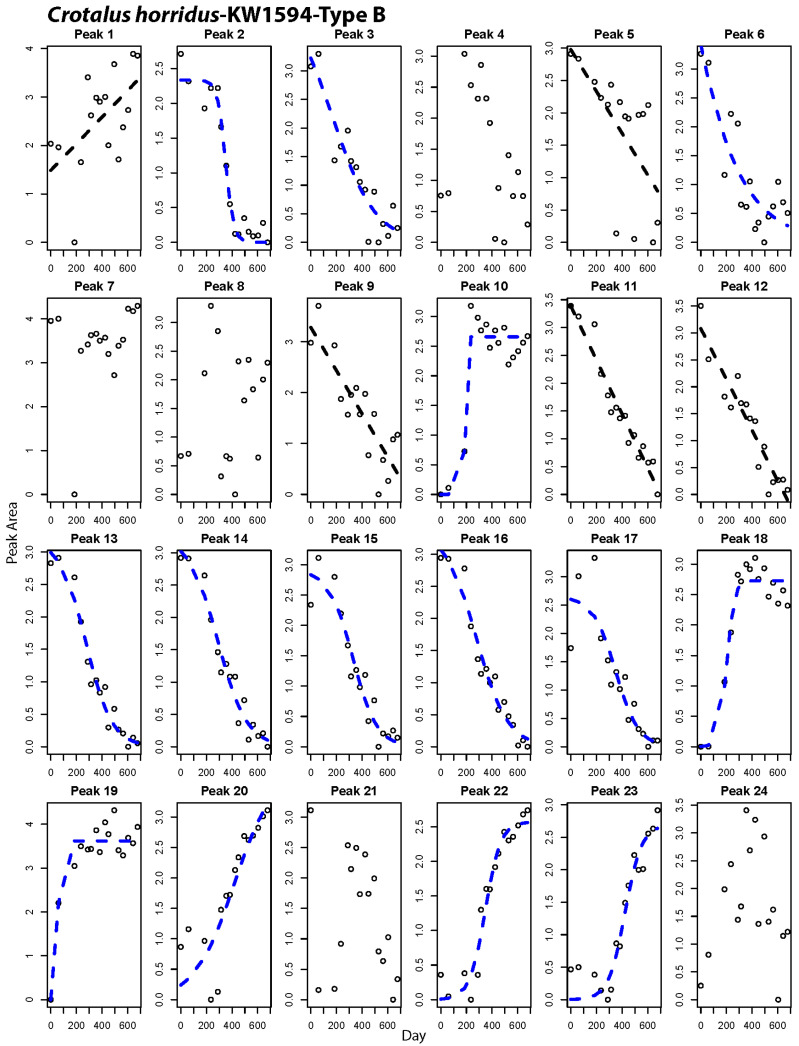
Figure 4.
Peak-by-peak analysis of relative abundance shifts over time for a Type B Crotalus horridus. Panels with best-fit lines indicate peaks that changed significantly in abundance over time. Black lines indicate best fit of a linear model to the data, while blue lines show cases where a non-linear fit was best.

