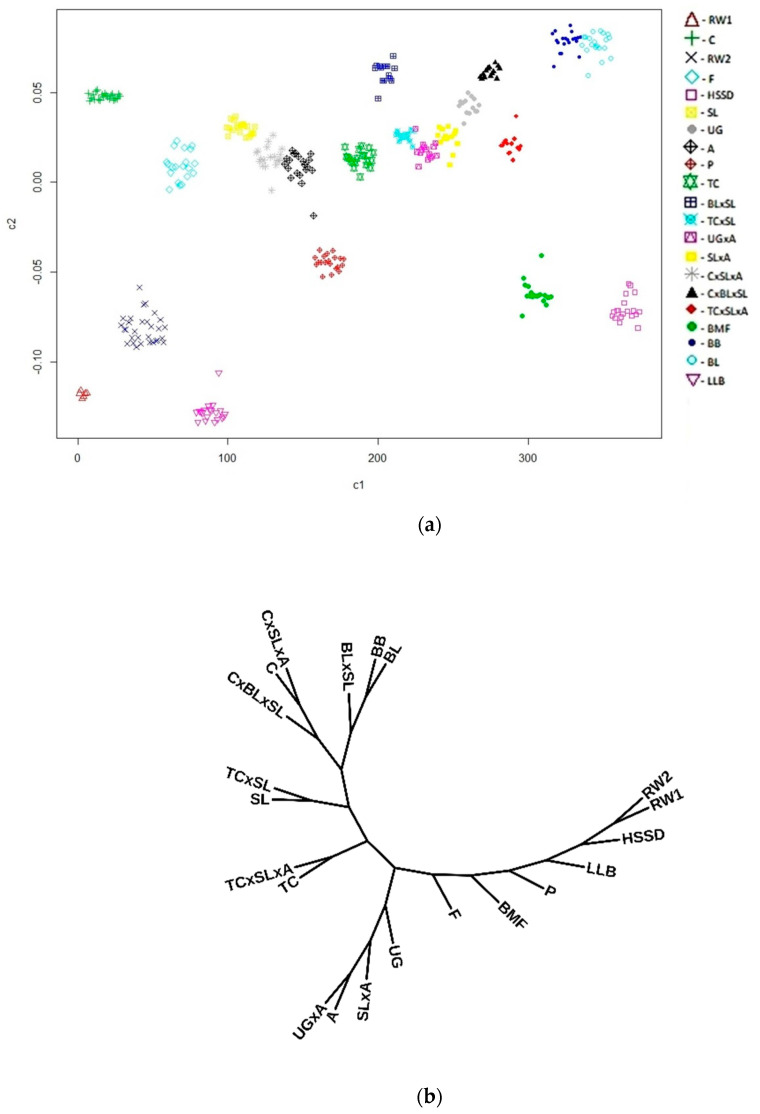
Figure 3.
Distribution of the 21 chicken populations studied on the basis of genotype data from 44,230 SNPs and values of (a) identity by state (IBS) matrix (Multidimensional scaling (MDS) plot using the first two principal components, c1 and c2) and (b) FST matrix (Neighbor Joining tree) that did not clearly discriminate between purebred and F1 crossbred populations. Abbreviations of all populations are given in Materials and Methods. There are many chicken breeds/populations in the world that could be similar in phenotype, but different in origin. This may cause a problem of identification and discrimination between breeds/populations, which can be solved with a high accuracy by comparing them against the available global database of SNP genotypes. The differentiation of individuals and their affiliation to a certain population or populations can be assessed using the MDS method. The accuracy of this analysis is significantly affected by the genetic background of populations selected for comparison, the breeding history of populations, and their effective population size. Therefore, there may be a bias in the assessment or false conclusions. For example, the distribution of F1 crossbreds in Figure 3a does not directly reflect their origin. The tree topology based on FST analysis (Figure 3b) also does not clearly suggest the original breeds used for producing F1 crossbreds.

