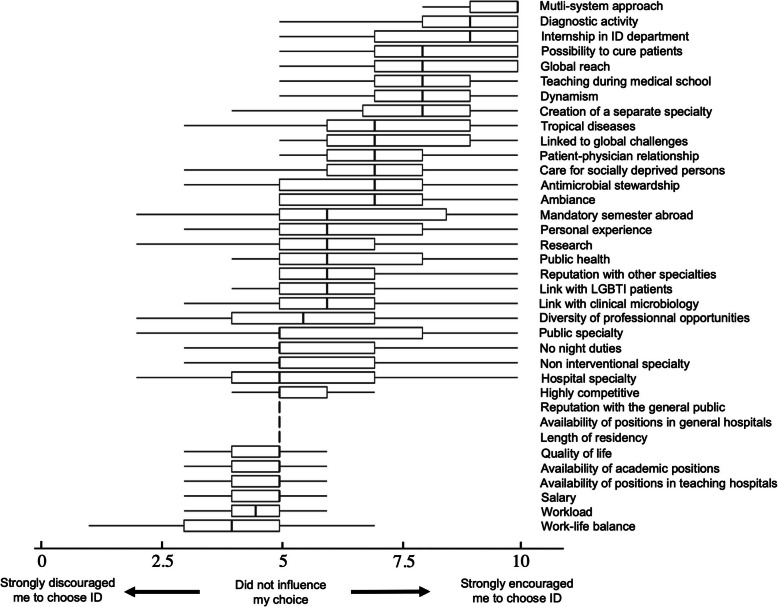
Fig. 2.
Motivations and reservations to choose ID specialty. Legend: Boxplots of the 36 factors that were evaluated by ID residents. The residents had to use a slider to say if this factor encouraged them to or discouraged them from choosing ID. The slider position was attributed a figure between 0 (strongly discouraged) to 10 (strongly encouraged). The lower and upper hinges correspond to the first and third quartiles. The upper and lower whisker extends from the hinge to the largest value no further than 1.5 x IQR from the hinge. The bold lines correspond to the medians

