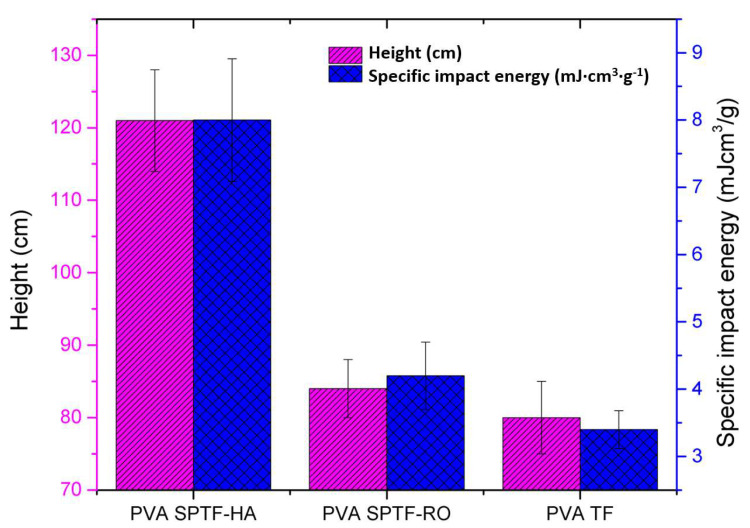
Figure 8.
The plot show heights of the free-falling ball, and its corresponding impact energy required to break the glass coverslip protected by the samples. Each bar in the plot depicts the data summarized from the impact test of five individual samples. The error bars represent the range of the data presented in the bar chart.

