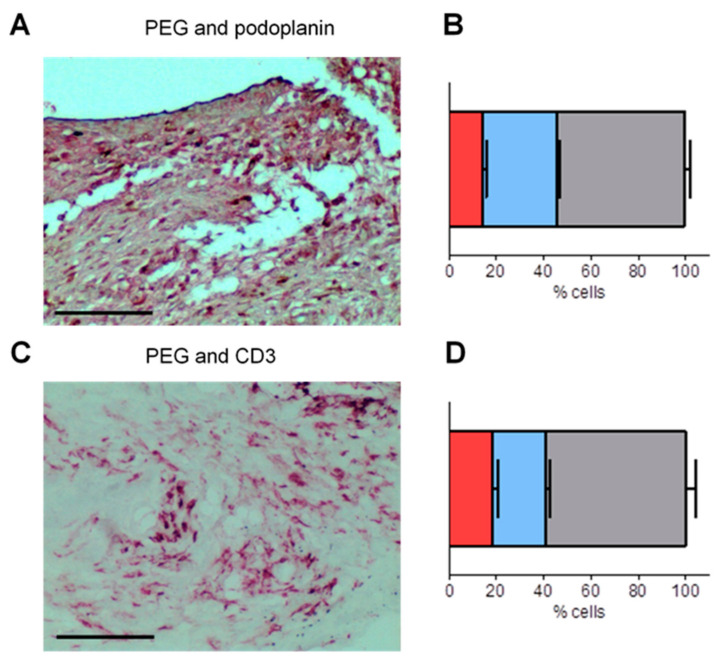
Figure 4.
PEG-HCCs colocalize with podoplanin- and CD3-expressing cells. (A) Staining of PEG in blue/grey and of podoplanin in red in the synovium of a PIA rat treated with PEG-HCCs. Scale bar = 100 μm. (B) Quantification of cells expressing only podoplanin in red, of cells expressing only PEG in blue, and of cells expressing both markers in grey. (C) Staining of PEG in blue/grey and of CD3 in red in the synovium of a PIA rat treated with PEG-HCCs. Scale bar = 100 μm. (D) Quantification of cells expressing only CD3 in red, of cells expressing only PEG in blue, and of cells expressing both markers in grey. n = 6.

