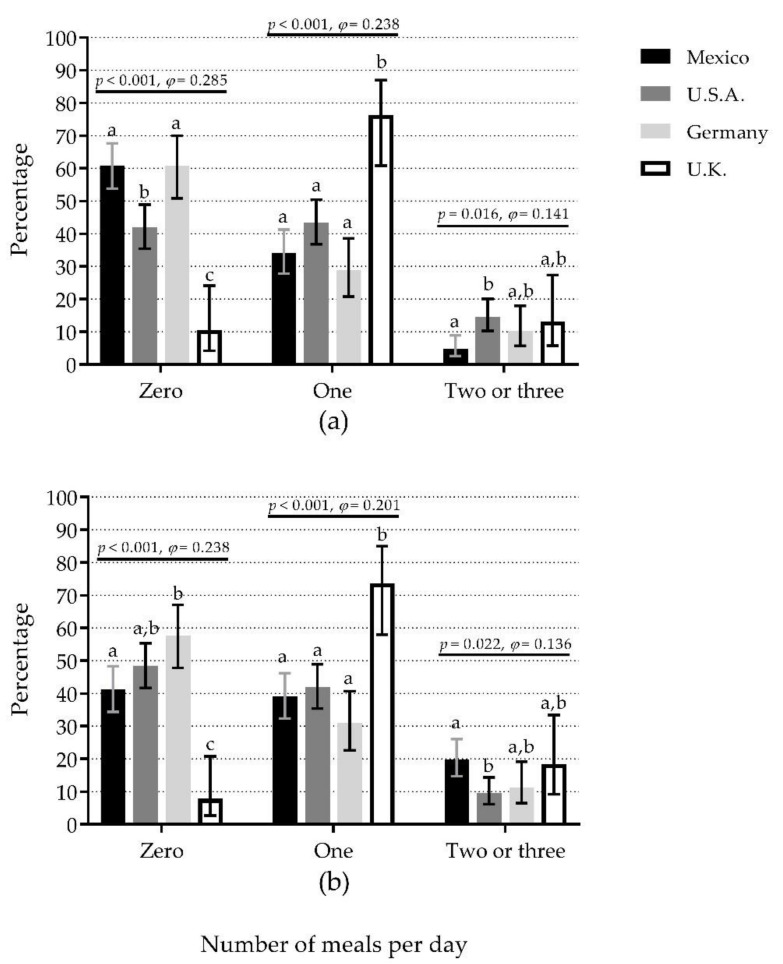
Figure 3.
The number of meals per day containing ≥30 g protein (a) or ≥0.4 g protein/kg body mass (b) compared among countries. Bars represent the percentage of participants that reported the number of meals per day (zero, one, and two or three) with the mentioned protein content; whiskers represent 95% confidence intervals. p-values and φ statistic are for comparisons among countries within the number of meals (χ2 test of independence). Bars not sharing a similar letter (a, b, c) denote significant differences (p ≤ 0.05) among countries within the number of meals (t-test for proportions with Bonferroni correction). U.K.: United Kingdom; U.S.A.: United States of America. Detailed data can be found in Table S3.

