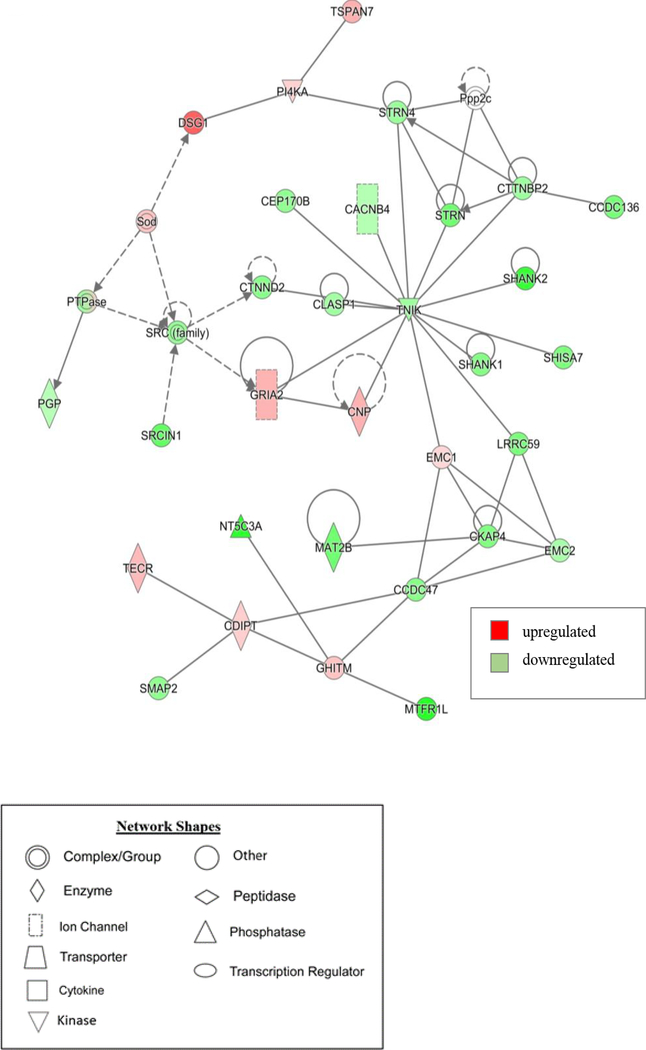
Figure 4. Graphic representation of mouse hippocampus protein network 1, identified by IPA as being affected by 10 Gy-treatment.
The color of the node depicts differential expression. Red represents upregulated proteins. Green represents downregulated proteins. The intensity of the color denotes the degree of regulation where brighter colors are more regulated. Gray node color reflects proteins that were found in the data set but were insignificant expression wise. Uncolored nodes were not identified as differentially expressed in our data, but were incorporated into the computational network based on evidence stored in the Ingenuity Knowledge Base. Known direct and indirect interactions between network proteins, as well as the direction of the interaction, are indicated by arrows or blocked lines.

