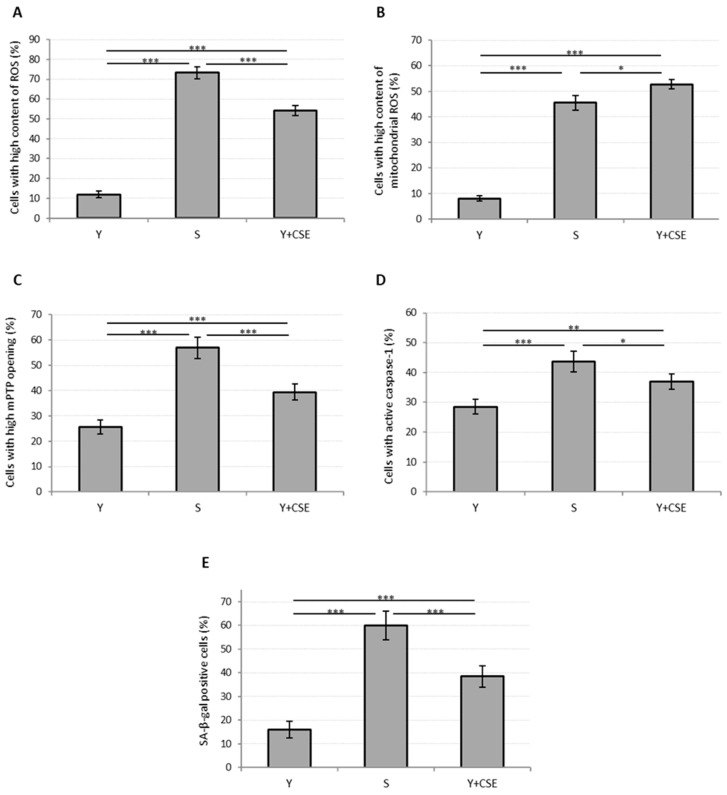
Figure 3.
Oxidative stress, mitochondrial functionality, caspase-1 activation and senescence in young HUVECs exposed to CSE (0.425 puffs/mL for 24 h). The histograms depict the results obtained from untreated young (Y) and untreated senescent (S) HUVECs and young HUVECs exposed to CSE (Y + CSE), that show the percentage of cells with: (A) high ROS content, (B) high mitochondrial ROS content, (C) high mPTP opening, (D) active caspase-1, (E) SA-β-galactosidase positive cells. * p ≤ 0.05, ** p ≤ 0.01, *** p ≤ 0.001.

