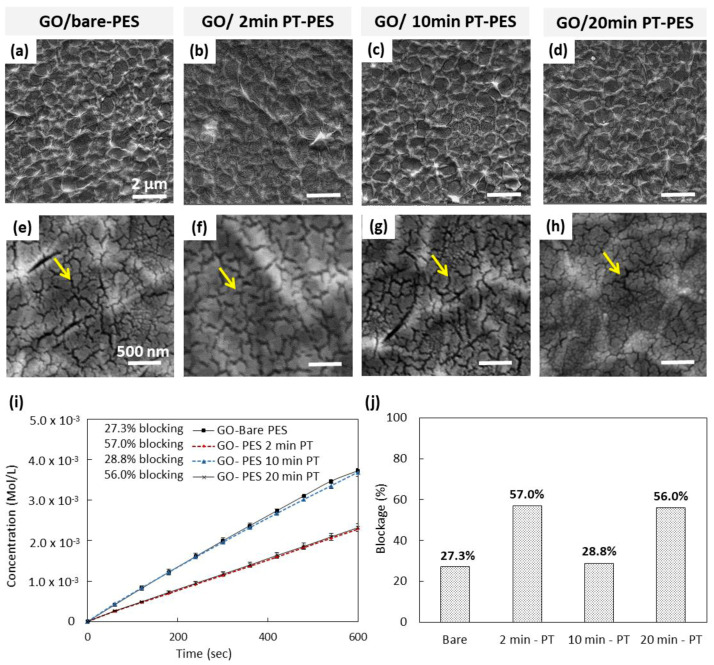
Figure 5.
Surface morphology and KCl ions diffusion study for the developed GO-based membranes at different PT times. SEM micrographs of (a,e) GO/bare-PES, (b,f) GO/2 min PT-PES, (c,g) GO/10 min PT-PES, (d,h) GO/20 min PT-PES. (i) Diffusion test results of the GO/PT-PES samples and (b) KCl ion rejection percent (%). Yellow arrows in the SEM images indicate the induced cracks in the GO layer due to water evaporation.

