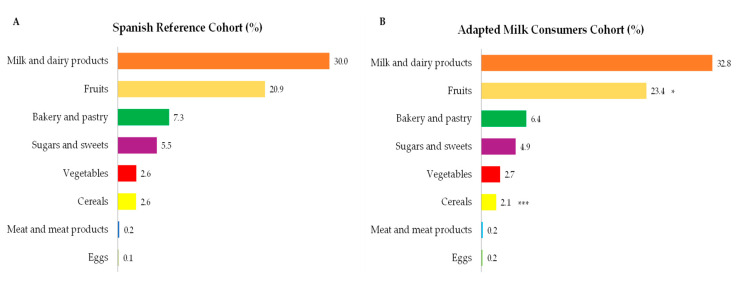
Figure 4.
Dietary food and beverage groups contributing to total sugar intakes (%) from the EsNuPI study population (“Spanish Pediatric Population”) in both Spanish Reference Cohort (A) and the Adapted Milk Consumers Cohort (B). * p ≤ 0.05 compared to reference cohort (Mann-Whitney test). *** p ≤ 0.001 compared to reference cohort (Mann-Whitney test). Only foods contributing ≥0.1% to total carbohydrates intakes of the population have been included.

