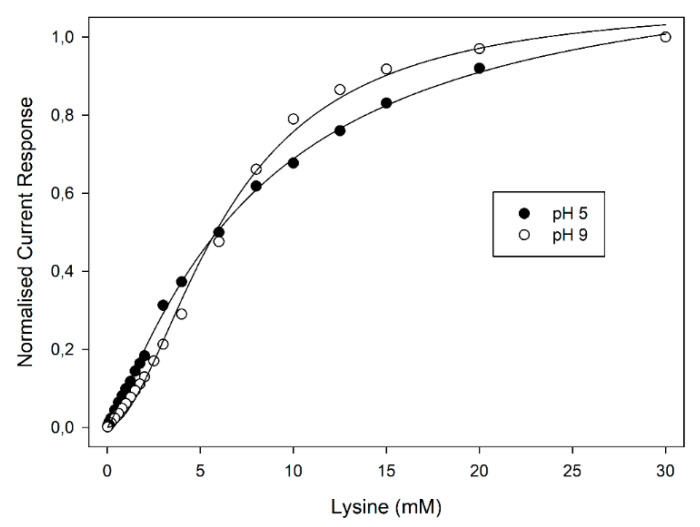
Figure 3.
Normalised current responses due to injections of L-lysine standard solutions at the amperometric enzyme electrode as a function of L-lysine concentration at pH 5 (•) and pH 9 (o). Continuous lines refer to Hill fitting of data. Flow rate: 1 mL min−1; other experimental conditions are described in the Materials and Methods section.

