Figure 3.
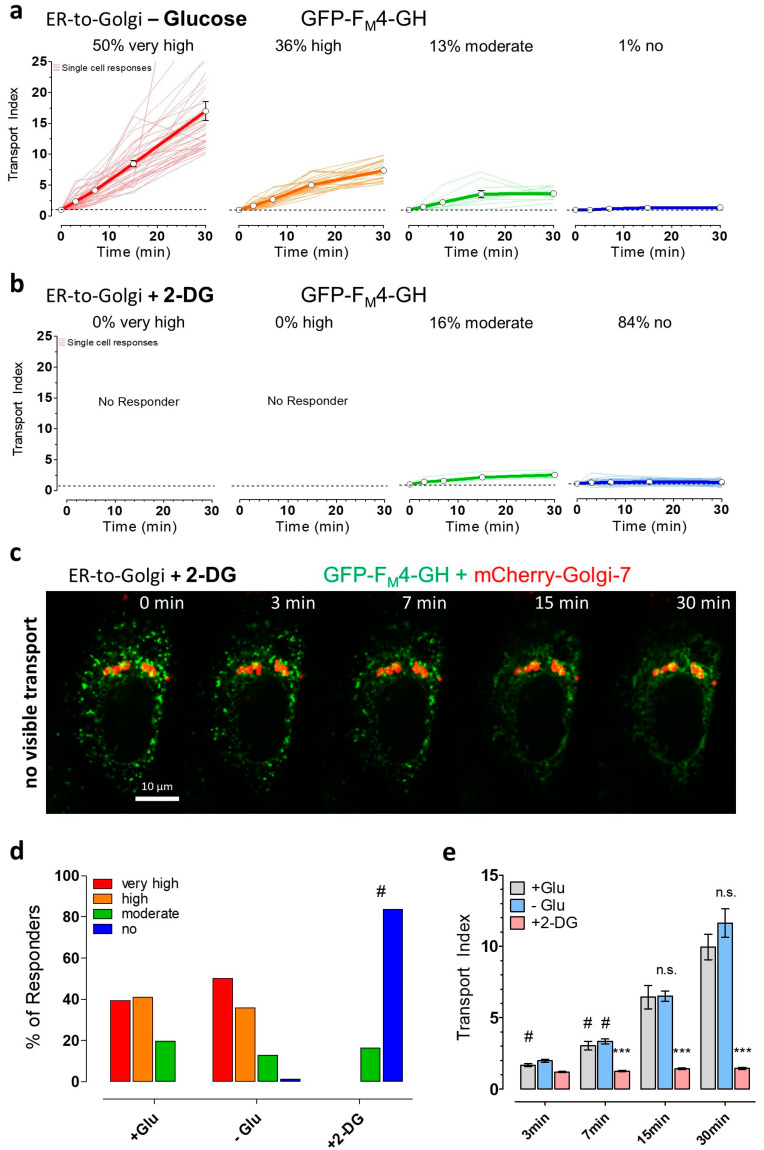
ER-to-Golgi transport of soluble cargo is facilitated by short-term glucose starvation but impaired by 2-DG. (a) ER-to-Golgi transport of GFP-FM4-GH in glucose-deprived single HeLa cells (n = 78 cells from 3 independent experiments) showing very high (red, transport index at 30 min > 10), high (orange, transport index > 5, <10), moderate transport index (green, transport index > 2, <5), and no transport (blue, transport index < 2). Cells were treated with buffer without glucose for 30 min prior to transport initiation by the addition of 250 nM solubilizer at 37 °C; (b) Classification as described in panel (a) of ER-to-Golgi transport in HeLa cells that were treated with 10 mM 2-DG, during and before (30 min) the addition of 250 nM solubilizer (n = 61 cells from 4 independent experiments); (c) A representative time course showing a 2-DG treated HeLa cell lacking ER-to-Golgi transport over time. Images were taken directly before solubilizer-addition (0 min) and 3, 7, 15, and 30 min after the addition of 250 nM solubilizer, respectively. The images show an overlay of the green channel (GFP-FM4-GH, soluble cargo) and red channel (mCherry-Golgi-7, Golgi marker). A 100× magnification objective was used, scale bar indicates 10 µm for every image in the time course; (d) Bars show the percentages of different ER-to-Golgi transport efficiencies in presence of 10 mM glucose (left bars, + Glu, control, n = 66 cells from 4 independent experiments), the absence of glucose (middle bars, − Glu, n = 78 cells from 3 independent experiments) and upon cell treatment with 10 mM 2-DG (right bars, + 2-DG, n = 61 cells from 4 independent experiments). # significant versus + Glu p < 0.05, Chi-square test; (e) Mean transport index comparison of HeLa cells of different pretreatment conditions (+ Glu (grey), n = 66 cells, − Glu (blue), n = 78 cells, + 2-DG (red), n = 61 cells) at the indicated time points after transport initiation. Bars represent mean ± SEM. n.s. not significant versus control (+ Glu) at the same time point, *** significant versus control (+ Glu) at the same time point p < 0.001, # significant versus all other time points of the same condition p < 0.05, Kruskal–Wallis test and Dunn’s post hoc test.

