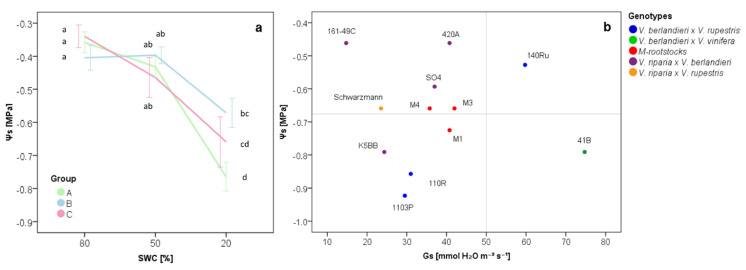
Figure 3.
Stem water potential (ΨS) as a function of decreasing soil water content (SWC) (a) and stomatal conductance (b). Groups are defined in Figure 2, according to the gas exchange values. Group A: 1103P, 110R, M1, M3 and M4 rootstocks; Group B: 161-49C, 420A, K5BB, Schwarzmann and SO4 rootstocks; Group C: 140Ru and 41B rootstocks. Letters show the statistical differences defined according to Tukey’s post hoc test at a p-value of 0.05. In plot (b), thresholds were set to 50 mmol H2O m−2 s−1 [47] for Gs and to the average for ΨS at 20% SWC.

