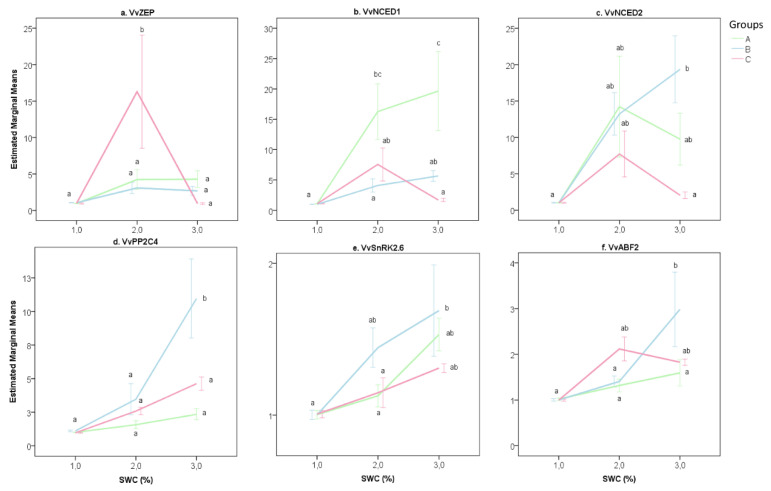
Figure 5.
Graphical representation of gene expression data of six genes related to the ABA metabolism in roots (a–c: VvZEP, VvNCED1 and VvNCED2) and leaves (d–f: VvPP2C4, VvSnRK2.6 and VvABF2) of 12 own-rooted grapevine rootstocks grown under limited water conditions (from 80 to 20% of soil water content, SWC). The genotypes are classified into three groups (A, B and C), as defined in Figure 2, according to the intrinsic water use efficiency. Average values and standard error are shown. Statistical differences are defined according to Tukey’s post hoc test at a p-value of 0.05. Group A: 1103P, 110R, M1, M3 and M4; Group B: 161-49C, 420A, K5BB, Schwarzmann and SO4; Group C: 140Ru and 41B.

