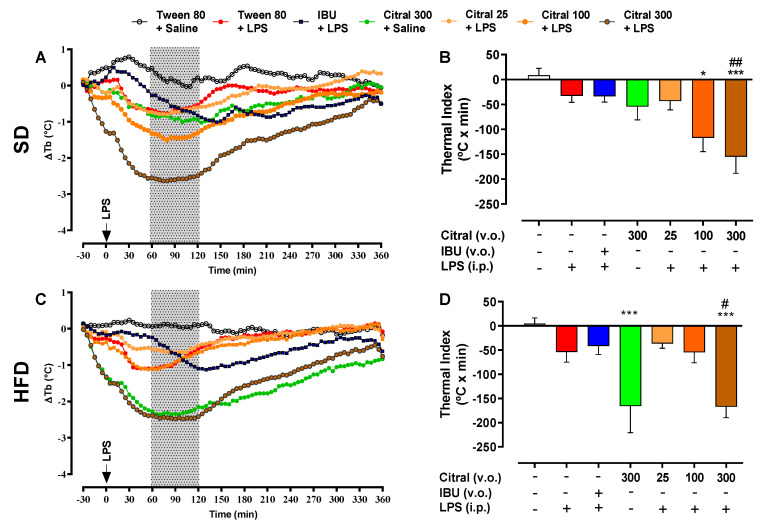
Figure 1.
Effect of citral (25, 100, and 300 mg/kg) and IBU (100 mg/kg) oral treatment (p.o.) on body temperature variation (∆Tb) profile of mice fed standard diet (SD) and high-fat diet (HFD) after LPS-induced Systemic Inflammation (SI). Tb profile of eutrophic (A) and obese (C) mice was observed for 360 min after intraperitoneal (i.p.) administration of LPS (100 µg/kg) or saline (1 mL/kg). The hatched area represents the period used for calculating the thermal index of SD (B) and HFD (D) during 60–120 min of SI. The results are presented as mean ± SEM for n = 7–9 per group. One-way ANOVA followed by Tukey’s test; * p < 0.05 and *** p < 0.001 vs. Tween 80 + saline; # p < 0.05 and ## p < 0.01 vs. Tween 80 + LPS.

