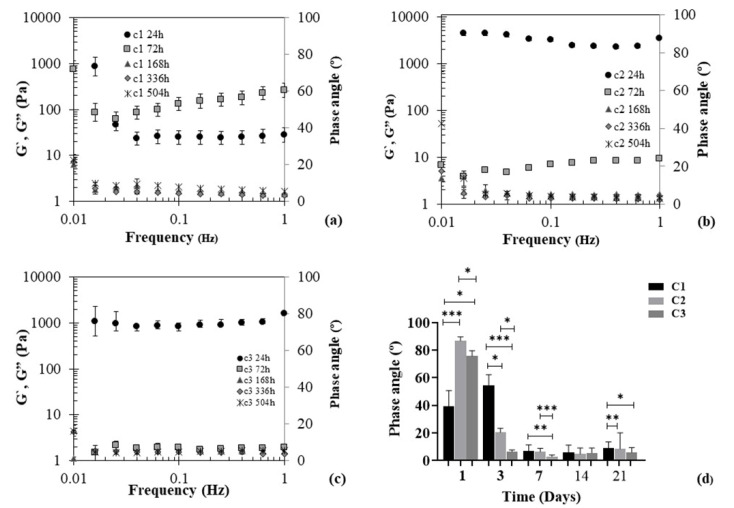
Figure 4.
Mechanical spectra of Ty–GG/SF hydrogels C1 (a), C2 (b) and C3 (c) and phase angle values (d) at different timepoints (24, 72, 168, 336 and 504 h). G′ (elastic moduli) and G″ (viscous moduli). Significant differences *** p < 0.001, ** p < 0.01 and * p < 0.05, by nonparametric Kruskal–Wallis test. There are not significant differences.

