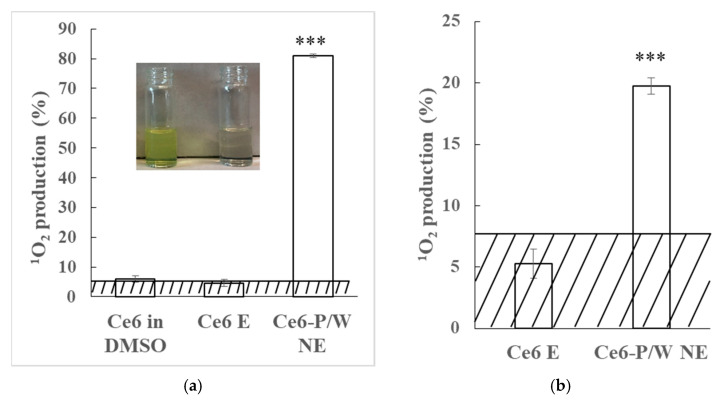
Figure 2.
1O2 production of the Ce6 in DMSO, Ce6 Es, and Ce6-P/W NEs under (a) ultrasound (0.25 W/cm2, 2.1 MHz, 1 min) or (b) light (633 nm, 50 mW/cm2, 2 min) irradiation in hypoxic condition at 1 mg/mL Ce6-P/W NE. The concentration was calculated as weight of Pluronic Mn 2900 and PFPE divided by the total volume. Ce6 concentration, 20 μg/mL. The inset is a photo of the Ce6 E (left) and the Ce6-P/W NE (right) with 1,3-diphenylisobenzofuran (DPBF) after ultrasound irradiation. Data were presented as mean value ± standard deviation. After Levene’s test for equality of variances, one-way analysis of variance (ANOVA) and Bonferroni multiple comparison test was employed for the comparison of mean values. n = 3. ***, p < 0.001. The shadow represents background signals detected by control (i.e., water containing only DPBF) groups (3.3098 ± 0.9599% for ultrasonic irradiation, and 7.5879 ± 2.1061% for light irradiation). 1O2, singlet oxygen. DMSO, dimethyl sulfoxide. Ce6 E, chlorin e6 emulsion. Ce6-P/W NE, chlorin e6-perfluoropolyether (PFPE)/water nanoemulsion.

