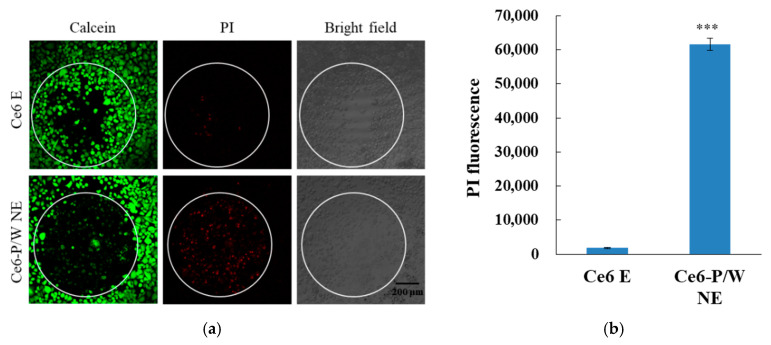
Figure 4.
(a) Calcein/PI staining and corresponding bright-field images and (b) necrosis indicated by PI fluorescence signals of cells treated with Ce6 E or Ce6-P/W NE upon light irradiation (633 nm, 50 mW/cm2) in a normoxic condition for 45 s. Ce6-P/W NE concentration, 400 μg/mL. Ce6 concentration, 8 μg/mL. Green color shows living cells, and red color shows dead cells. The white circle indicates the irradiation area. Data were presented as mean value ± standard deviation. After Levene’s test for equality of variances, Student’s t test was employed for the comparison of mean values. n = 3. ***, p < 0.001. PI, propidium iodide. Ce6 E, chlorin e6 emulsion. Ce6-P/W NE, chlorin e6-perfluoropolyether (PFPE)/water nanoemulsion.

