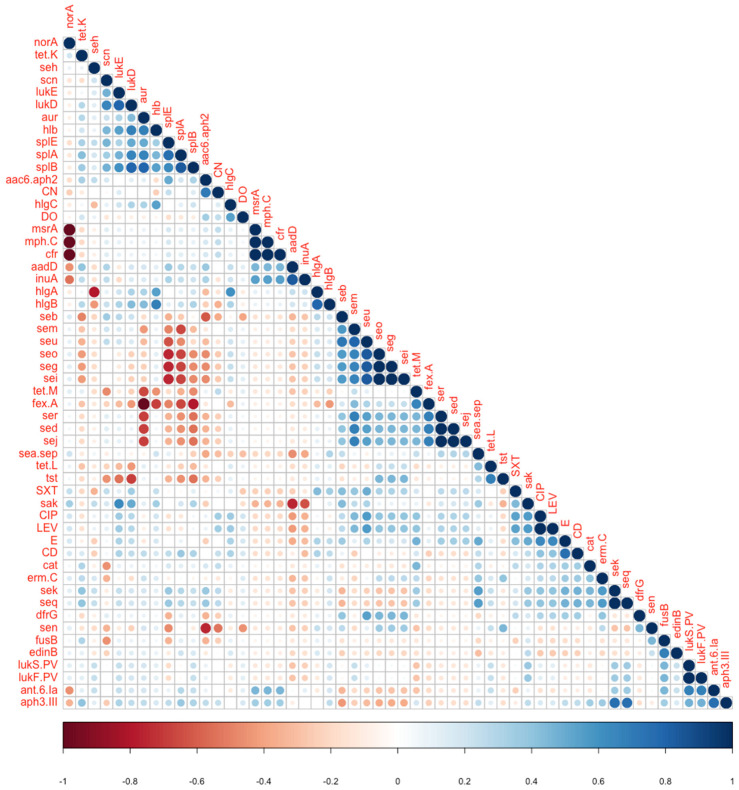
Figure 3.
Correlation matrix indicating all correlations between pairs of genetic or phenotypic determinants (resistance phenotypes). Shades of blue represent positive correlations, while shades of orange/red represent negative correlations. Similar analyses were conducted separately among resistance-related pairs of traits and virulence-related ones (Supplementary Figure S1).

