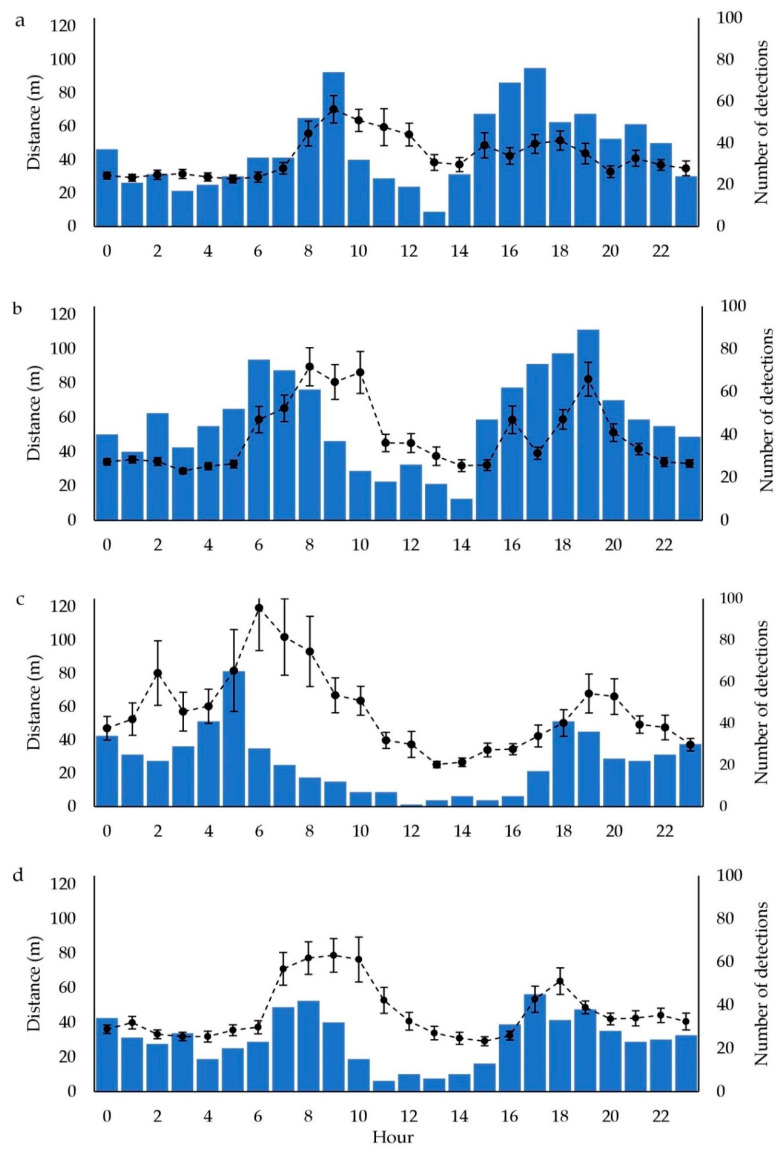
Figure 6.
Average total distance moved per hour for the kangaroos surviving for the duration of the project (line plot with standard error bars and left axis) and number of single detections of resident kangaroos for each camera within each hour from the camera array (bars and right axis) for (a) winter, (b) spring, (c) summer and (d) autumn.

