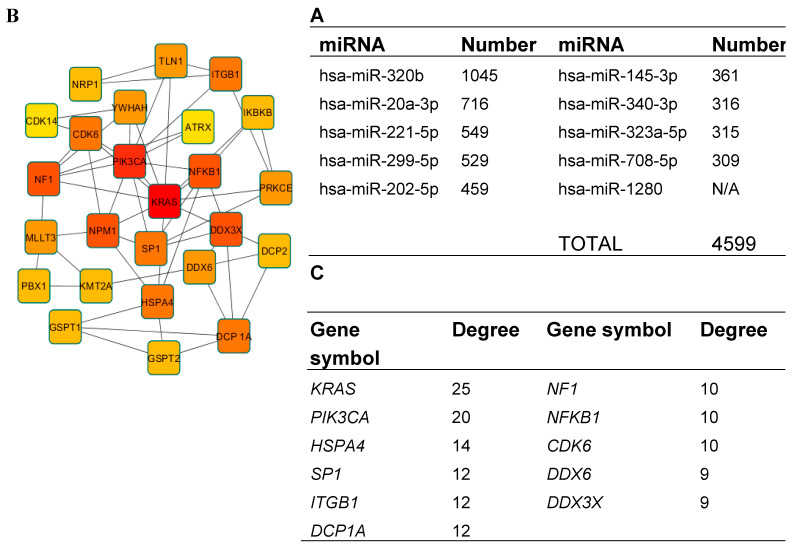
Figure 7.
Target prediction and protein–protein interaction (PPI) analysis. (A) The predicted target number of the 10 most highly expressed miRNAs. For miRNA–1280, no targets were detected; (B) the top 25 genes in PPI network of predicted target genes (node color: deeper colors indicate higher degree); (C) the top 11 genes identified in PPI network with the highest degree of connectivity.

