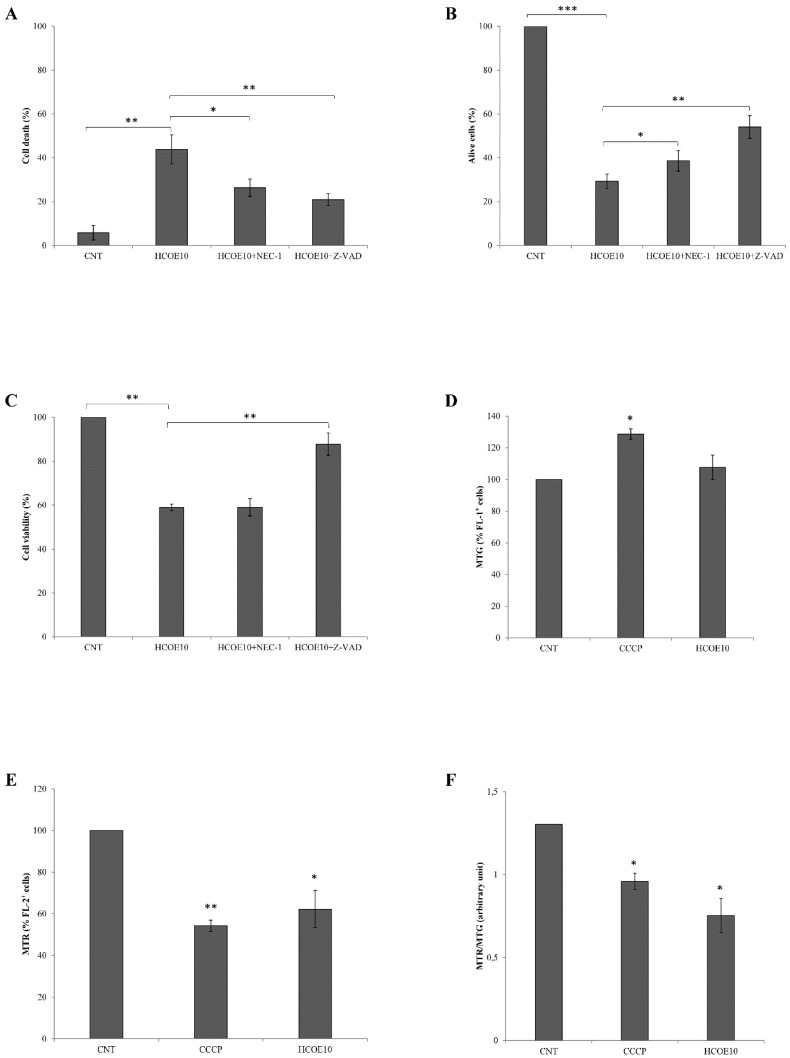
Figure 4.
Cell death analysis and mitochondrial damage evaluation. A375 cell proliferation was analyzed after treatment, for 48 h, with 10 mg/mL HCOE, 10 mg/mL HCOE + 20 µM necrostatin-1 (HCOE10 + NEC-1), or 10 mg/mL HCOE + 20 µM Z-VAD-FMK (HCOE10+Z-VAD). (A) Cell death percentage was evaluated by flow cytometric assay, counting sub-G1 events. Results are expressed as mean ± SD of three independent experiments (* p < 0.05; ** p < 0.01 vs. control). (B) Alive cells were counted by the Trypan Blue exclusion test at 48 h of treatment with HCOE10, HCOE10+NEC-1, and HCOE10+Z-VAD. Results expressed as percentage with respect to the PBS control (CNT; considered as unit, 100%) are expressed as the mean ± SD of three independent experiments (* p < 0.05; ** p < 0.01; *** p < 0.001 vs. control). (C) A375 cell viability was measured by MTT assay after 48 h of treatment with HCOE10, HCOE10+NEC-1, and HCOE10+Z-VAD. Results, expressed as percentage with respect to the PBS control (CNT; considered as unit, 100%), represent the mean ± SD of three independent experiments (** p < 0.01 vs. control). Mitochondrial mass (D) and membrane potential (E) measurements, after 4 h of treatment with carbonyl cyanide m-chlorophenyl hydrazone (CCCP) (10 µM) (used as positive control) or 48 h of incubation with 10 mg/mL HCOE, were carried out by using MitoTracker Green (MTG) and MitoTracker Red CMX ROS (MTR), respectively. Results are expressed as percentage variation of fluorescence with respect to PBS control (CNT; considered as unit, 100%) (* p < 0.05; ** p < 0.01 vs. control). (F) Changes in mitochondrial membrane potential are expressed as MTG/MTR ratio (* p < 0.05 vs. control).

