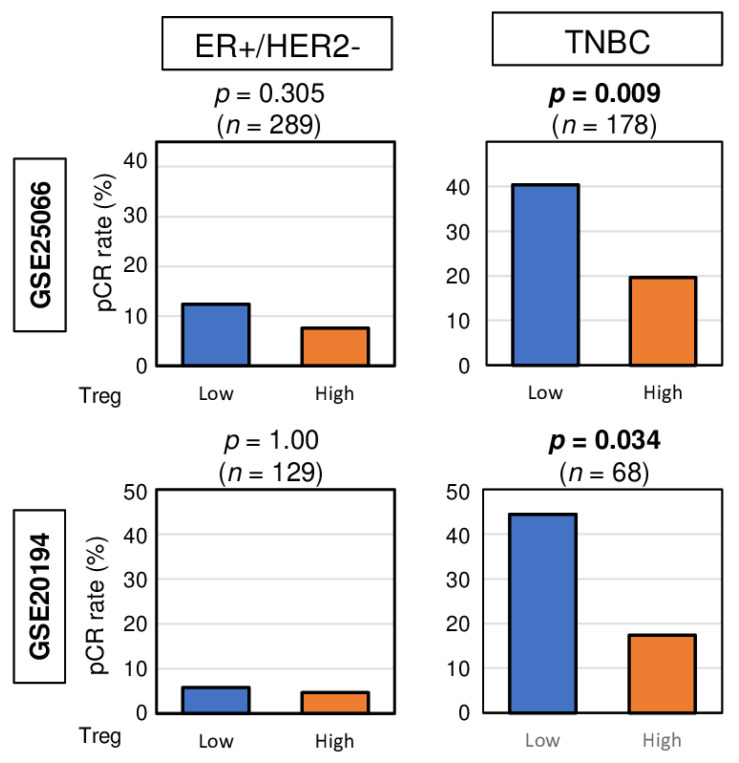
Figure 4.
Bar plots depicting the pCR rates between low and high abundance of Treg groups among patients with ER-positive/HER2-negative tumors and TNBCs in the GSE25066 (n = 508) and GSE20194 (n = 248) cohorts. These cohorts were chosen because of their response to neoadjuvant chemotherapy data. Fisher’s exact test was used for the analysis.

