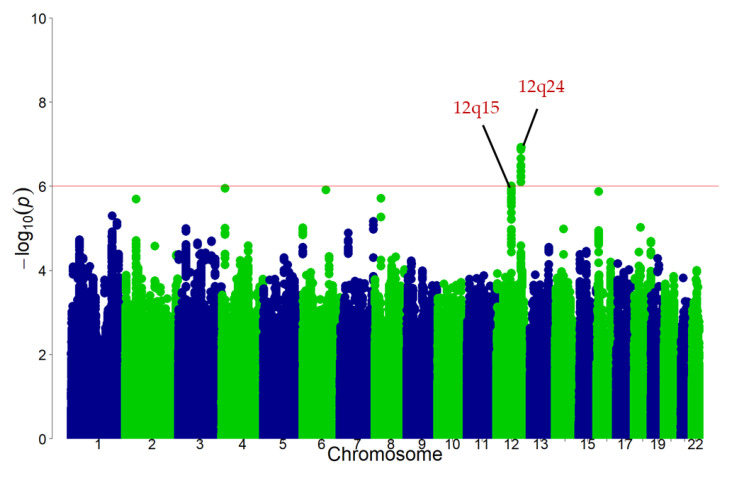
Figure 3.
Manhattan plot for the discovery GWAS of habitual black tea consumption in the Japanese population. Single nucleotide polymorphism (SNPs) are ordered by chromosome and position in the x-axis. The y-axis shows the negative logarithm of the association of each SNP with black tea consumption. The red line represents p < 1.0 × 10⁻⁶. GWAS: genome-wide association study.

