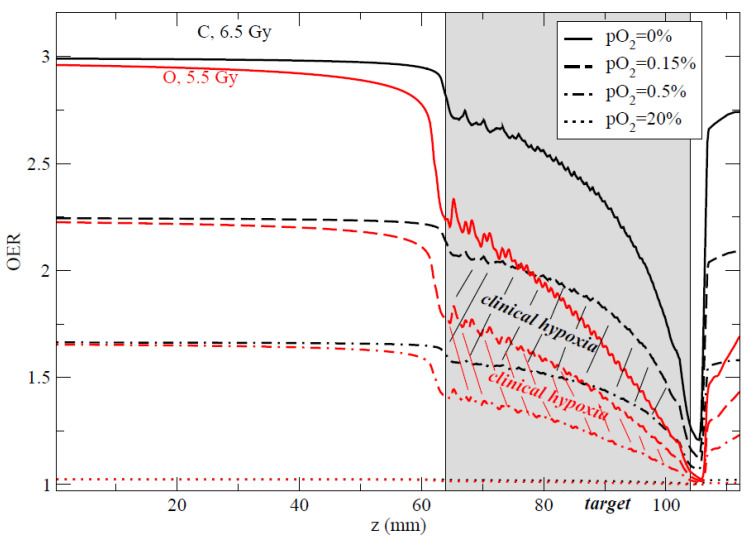
Figure 11.
Comparison of the computed OER along an SOBP for carbon (black curves) and oxygen (red curves) at different pO2 levels. The hatched areas represent the clinical interesting regions for hypoxia (0.15% < pO2 < 0.5%). Doses indicated are prescribed RBE-weighted doses in the target to achieve iso-survival. Plans for using 16O in the clinics are currently under way at HIT (Heidelberg). Plot from [159], © Institute of Physics and Engineering in Medicine. Reproduced by permission of IOP Publishing. All rights reserved.

