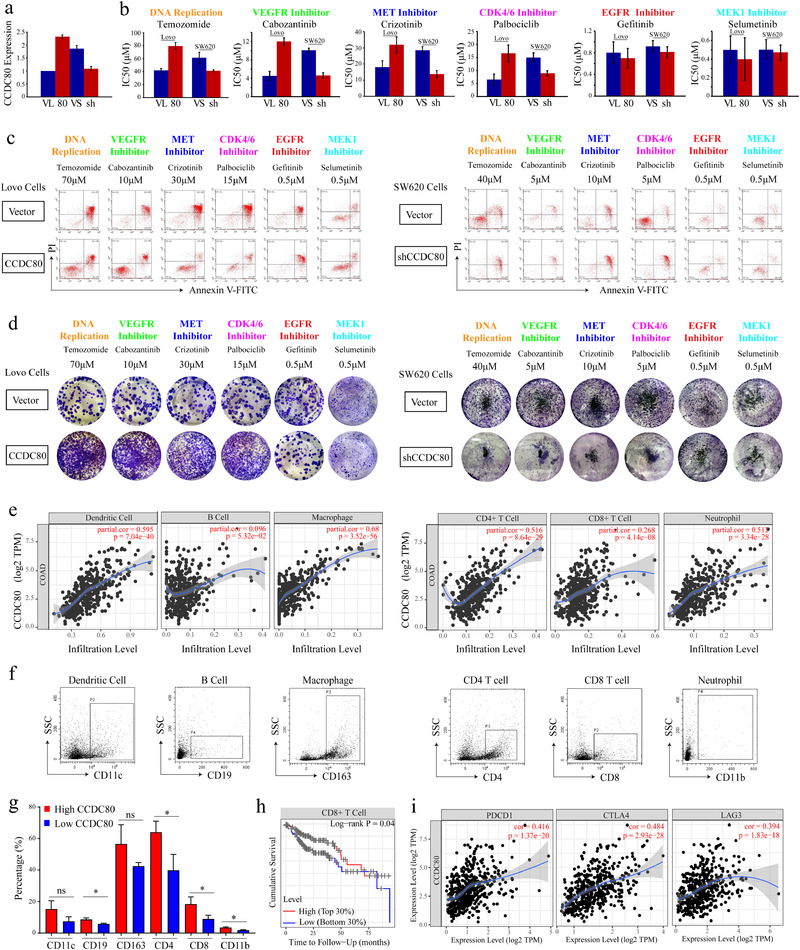
FIGURE 3.

Acquired drug resistance and immune infiltration of CCDC80 in CRC. A, Results of RT‐PCR for CCDC80 in Lovo and SW620 cells transfected with vector, CCDC80 plasmid, or CCDC80 shRNA. B, IC50 of representative drugs in Lovo cells transfected with vector (VL) or CCDC80 (80) (left) and in SW620 cells transfected with vector (VS) or CCDC80 shRNA (sh) (right). C, Apoptosis induced by drugs in Lovo cells transfected with vector or CCDC80 (left) and in SW620 cells transfected with vector or CCDC80 shRNA (right). D, Clonal forming analysis of Lovo cells transfected with vector or CCDC80 (left) and SW620 cells transfected with vector or CCDC80 shRNA (right) treated with representative drugs. E, The correlation between the immune cells and the expression of CCDC80. F, Representative flow cytometry plots of infiltrated immune cells in patient samples. G, Statistical analysis of the percentage of infiltrated immune cells in primary samples. H, The correlation between CCDC80 expression and immunotherapy targets such as PD‐1, CTLA4, TIM‐3, and LAG‐3. I, The cumulative survival of CD8+ T cells in CRC samples
