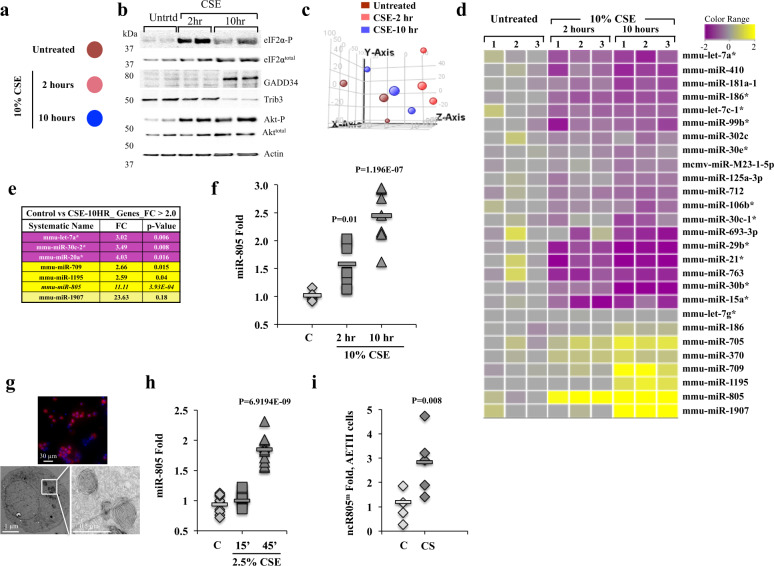
Fig. 1. Identification of miRNAs regulated by CSE treatment.
a Key of experimental treatments of MLE12 cells with 10% CSE for 0 (untreated), 2, or 10 h. b Untreated and treated with 10% CSE for 2 and 10 h MLE12 cells were assayed for changes in protein levels associated with stress signaling. Actin was used as a loading control. c GeneSpring 11.0 principle component analysis of untreated cells, and two time points of CSE treatment. d Hierarchical clustering of 27 differentially expressed miRNAs obtained from three independent biological experiments. Expression of microRNAs was assayed in untreated and 10% CSE-exposed MLE12 cells using GeneSpring GX 11.0. e Table of select microRNAs from d with the highest changes. f RT-qPCR was used to confirm miR-805 expression in MLE12 cells exposed to 10% CSE for 2 h (n = 3 independent experiments/with 9 independent samples, p = 0.01) and 10 h (n = 3, independent experiments/with 9 independent samples, p = 1.196E−07). g Primary AETII cells were isolated from mouse lungs and their phenotype was verified using antibodies specific to staining lamellar bodies (3C9), showing a 92% purity of isolated AETII cells (111 3C9-positive cells out of total of 121 DAPI nuclei, upper panel). Isolated AETII cells were plated, allowed to adhere and recover from the isolation procedure for 3 days, fixed using Karnovsky’s fixation protocol, and processed for TEM to visualize laminar bodies. Images were acquired using JEM 1011 TEM microscope. h Mouse primary AETII cells from four independent isolations were plated, cultured for 3 days, and exposed to 2.5% CSE for 15 and 45 min. miRNA-enriched RNA was isolated and tested for the expression of miR-805 by RT-qPCR (Control n = 3 independent experiments/with 9 independent samples, 15 min n = 3 independent experiments/with 9 independent samples, p value = 0.006, and 45 min n = 3 independent experiments/with 12 independent samples, p value = 06.9194E−09). i Primary AETII cells isolated from mice exposed to CS for 3 months twice daily (n = 5 animals for control, and n = 5 animals for CS-exposed animals, p = 0.008). All p values indicate the comparison of treated sample values to respective control untreated. RT-qPCR levels of mito-ncR-805 were normalized to sno55RNA in all panels; folds calculated to respective controls.

