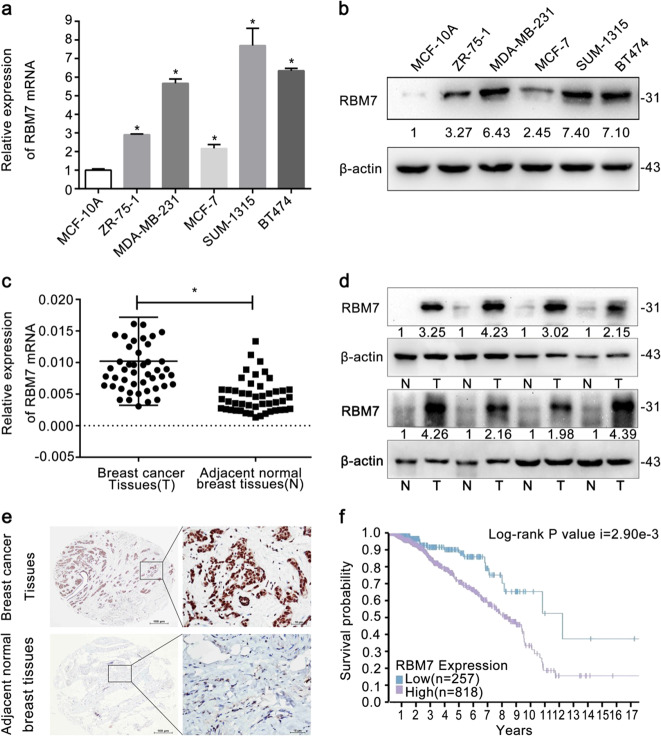
Fig. 1. Expression of RBM7 in human breast cancer.
a RT-qPCR analysis of RBM7 mRNA expression in breast cancer cells and normal epithelial cell line MCF-10A. The relative quantification was calculated by the 2–ΔΔCt method and normalized based on β-actin (*P < 0.05). b Western blot analysis of RBM7 expression in breast cancer cells and normal epithelial cell line MCF-10A. The fold change of RBM7 protein was shown below each lane. The intensity of the bands was determined using densitometric analysis. c Average expression level of RBM7 mRNA in 46 pairs of human breast cancer tissues and adjacent normal breast tissues. The relative quantification was calculated by the 2–ΔCt method and normalized based on β-actin (*P < 0.05). d Expression of the RBM7 protein in eight pairs of breast cancer and adjacent tissues. The fold change in elevated RBM7 was shown below each lane compared to adjacent normal breast tissues. The intensity of the bands was determined using densitometric analysis. e Representative images of RBM7 in breast cancer and adjacent normal breast tissues by IHC analysis. RBM7 was mainly expressed in nucleus. Scale bars indicated 100 μm. f Survival probability showed that patients with low RBM7 expression (n = 257) in breast cancer patients had a better prognosis than those with high RBM7 expression (n = 818) group (Log-rank P value i = 2.90e−3).

