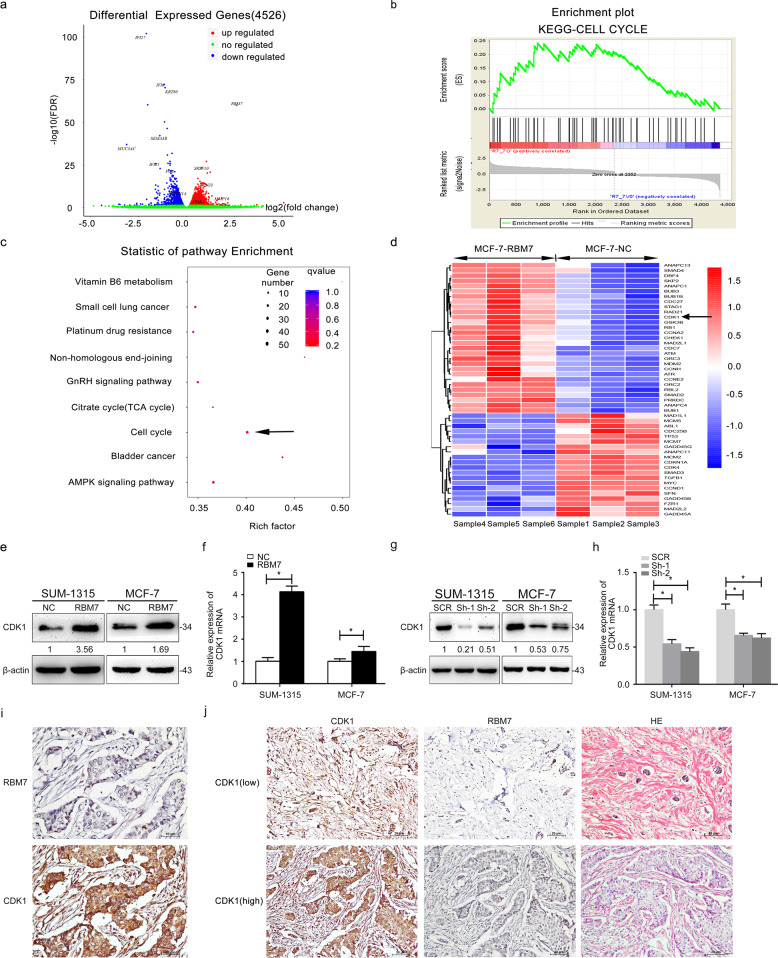
Fig. 4. RBM7 regulated CDK1 expression positively.
a Total 4526 genes were differentially identified from mRNA sequencing. Among them, 2470 genes (red) were upregulated and 2056 genes (blue) were downregulated. b Gene set enrichment analysis (GSEA) of differentially expressed genes. c Enrichment analysis of the KEGG pathway was used to analyze the distribution of differentially expressed genes in cell cycle pathways. The size and color of the dots represented the number of enriched genes and q values, respectively. d Heatmap represented the downregulated and upregulated genes measured in MCF-7 cells. The expressions of CDK1 and RBM7 were marked. The arrow indicated that CDK1 was upregulated in the RBM7 overexpression group. e–h The overexpression of RBM7 significantly increased CDK1 (e, f), whereas the knockdown of RBM7 deceased the expression of CDK1 in SUM-1315 cells. Similar results were observed in MCF-7 cells (g, h). The intensity of the bands was determined using densitometric analysis. The fold changes were shown below each lane. The relative quantification was calculated by the 2−ΔΔCt method and normalized based on β-actin (*P < 0.05). i RBM7 expression was positively related to CDK1 in breast cancer tissues. The immunohistochemistry analysis of CDK1 and RBM7 in breast cancer tissue was at 400× magnification. The arrow showed the location of RBM7 and CDK1 was mainly expressed in nucleus. Scale bars indicated 10 μm. j Representative images of moderate and the relative RBM7 staining in CDK1 high and low positive breast cancer tissues (n = 64, *P < 0.05) by IHC staining. Scale bars indicated 20 μm. The correlation between RBM7 expression and clinic pathological features was showed in Table 1 (*P < 0.05).

