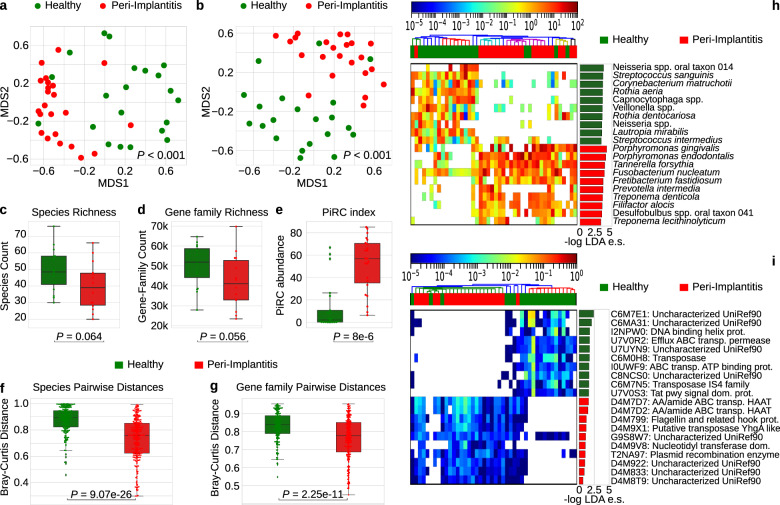
Fig. 1. The plaque microbiome strongly differs in healthy and peri-implantitis sites.
a Multidimensional scaling (MDS) ordination plot of healthy and peri-implantitis sites based on the Bray–Curtis distance between microbiome samples highlights a strong condition-specific clustering. p values were obtained by PERMANOVA. b Ordination plot (MDS) of healthy and peri-implantitis metagenomic samples based on the abundance of microbial UniProt90 gene families. p values were obtained by PERMANOVA. c Alpha-diversity distributions computed after rarefaction to the same sequencing depth and estimated as the richness of species and d as richness of UniProt90 gene families show a trend of decreased diversity in peri-implantitis sites. p values were obtained by the two-tailed Wilcoxon signed-rank test. e Distribution of PiRC index values (the total abundance species in the peri-implantitis-related complex) in healthy and peri-implantitis samples. p value was obtained by the two-tailed Wilcoxon signed-rank test. f Intra-condition beta-diversity (Bray–Curtis dissimilarity) for microbial species and g gene families points at a converging microbiome structure in diseased peri-implantitis sites. p values were obtained by two-tailed Wilcoxon signed-rank test. h Relative abundances (log scale) and effect sizes (LDA score from LEfSe) of the 10 microbial species and i gene families most strongly associated with either the healthy sites or the sites with peri-implantitis (top 10 species/gene families effect sizes per class). All the comparisons in this figure are performed using the sample from the main site in each subject without considering the contralateral samples.

