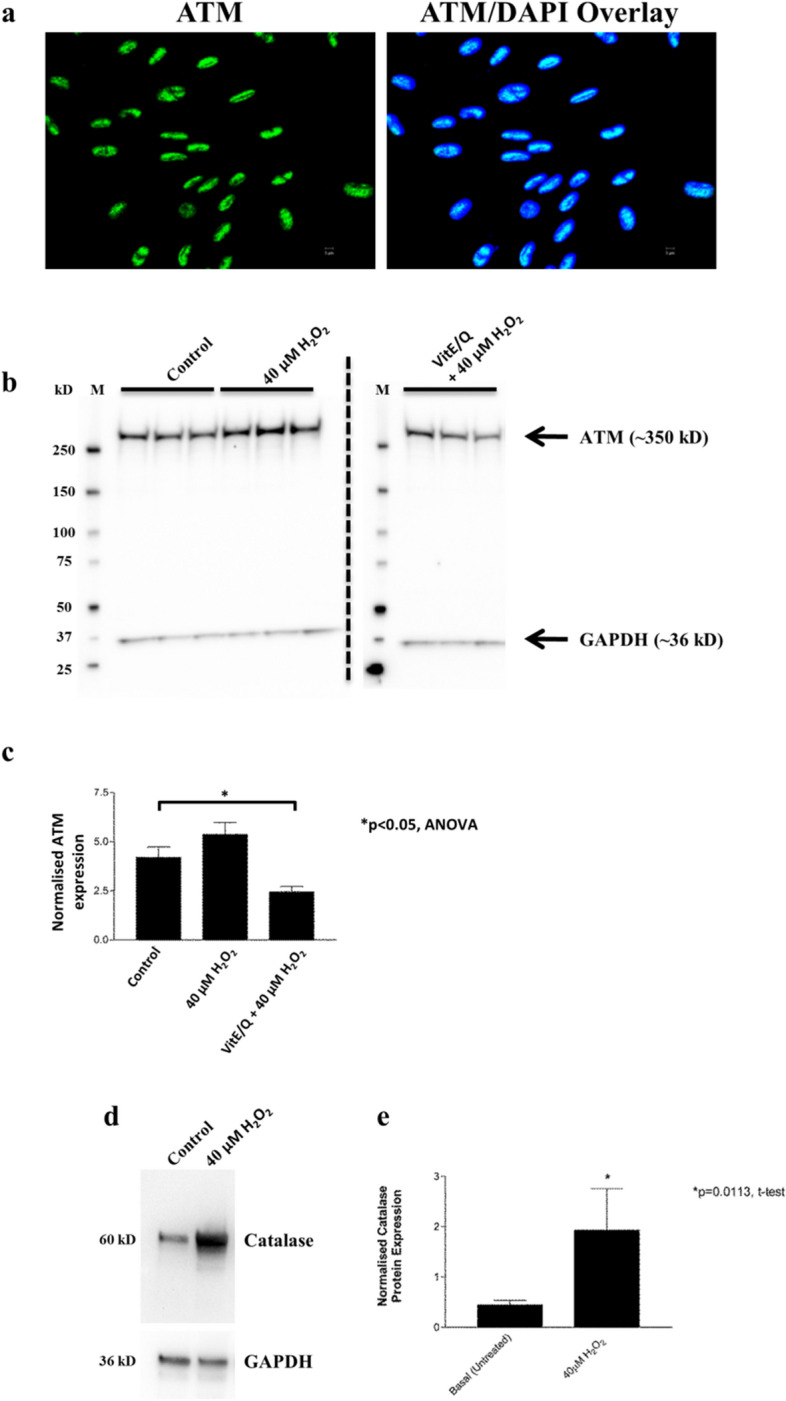
Figure 4.

(a) ATM is expressed in HFM’s in vitro. Immunocytochemistry staining showing the nuclear expression of ATM protein (green channel; left image) in cultured primary hair follicle melanocytes (from male scalp, 20-year old). DAPI nuclear stain (blue channel) is co-localised with nuclear ATM staining on the right-hand side image. Scale bars are shown on each image. (b) and (c) ATM expression is increased in HFM after exposure to oxidative stress and can be reduced by antioxidants. HFM were treated with 40 µM H2O2 for 1 h in parallel with untreated control cells and cells pre-treated for 1 h with the antioxidants VitE/Q prior to H2O2 addition. Levels of ATM protein expression (~ 350 kD) were assessed by Western blot (b). Antioxidant-treated samples were loaded on a second gel and processed in parallel with other samples under identical conditions. GAPDH (~ 36 kD) was used as a loading control. Marker is shown in the first lane of each gel (M). An increase in ATM protein expression could be seen in H2O2 treated samples compared to control untreated cells (ns). Levels of ATM could be significantly decreased by preincubation with VitE/Q for 1 h before H2O2 treatment (*p < 0.05 versus control, ANOVA; n = 3). Graph in c shows quantification of mean ATM expression (normalised to GAPDH in relative densitometry units) from the Western blot. (d) and (e) Catalase expression is increased in HFMs after exposure to hydrogen peroxide. Representative Western blot showing induction of catalase protein expression (~ 60 kD) in HFM’s after treatment for 1 h with 40 µM hydrogen peroxide. GAPDH (36kD) was used as a loading control. Graph in e shows quantification of mean catalase expression (normalised to GAPDH in relative densitometry units) from Western blots after 40 µM H2O2 treatment (n = 3). Unpaired t-test (*p = 0.0113) compared 40 µM H2O2 treated cells versus controls.
