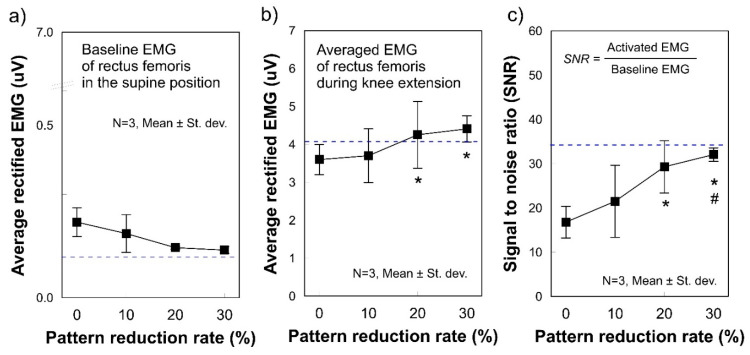
Figure 5.
Average rectified SEMG of the baseline and during muscle activation for different pattern reduction rates. (a) baseline electrode noise and (b) SEMG amplitude during muscle contractions exerted by knee extension; (c) Signal to noise ratio (SNR). SEMG was measured on the rectus femoris with stretchable leg sleeves where circle electrodes with different diameters were embedded. The values were calculated by averaging three consecutive measurements from three leg-sleeve samples in each diameter. * p < 0.1 versus 0%, # p < 0.1 versus 10%. Non-parametric statistics verified all significances. The Kruskal–Wallis test was used to identify group differences with the Mann-Whitney U test used as a post hoc test.

