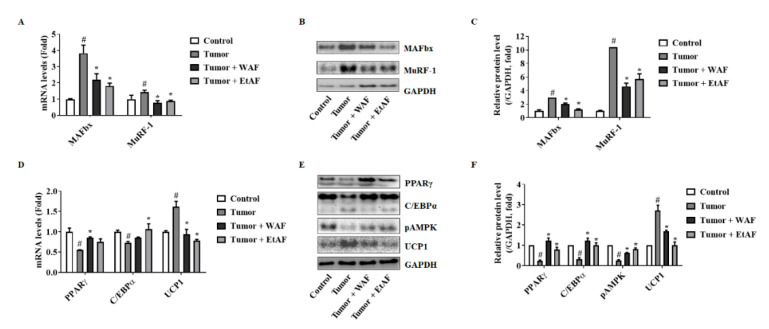
Figure 4.
Effects of AF in gMuscle and eWAT from CT-26 tumor-bearing mice. mRNA levels of MAFbx and MuRF-1 in gMuscle (A). The proteins levels of MAFbx and MuRF-1 (B) and relative levels (C) in gMuscle. The mRNA expression levels of PPARγ, C/EBPα, and UCP1 in eWAT (D). The protein levels of PPARγ, C/EBPα, pAMPK, and UCP1 in eWAT (E). The relative protein expression levels of eWAT (F). GAPDH was used as an endogenous control. All values are mean ± SD. # p < 0.05, significantly different from control group; * p < 0.05, significantly different from tumor group.

