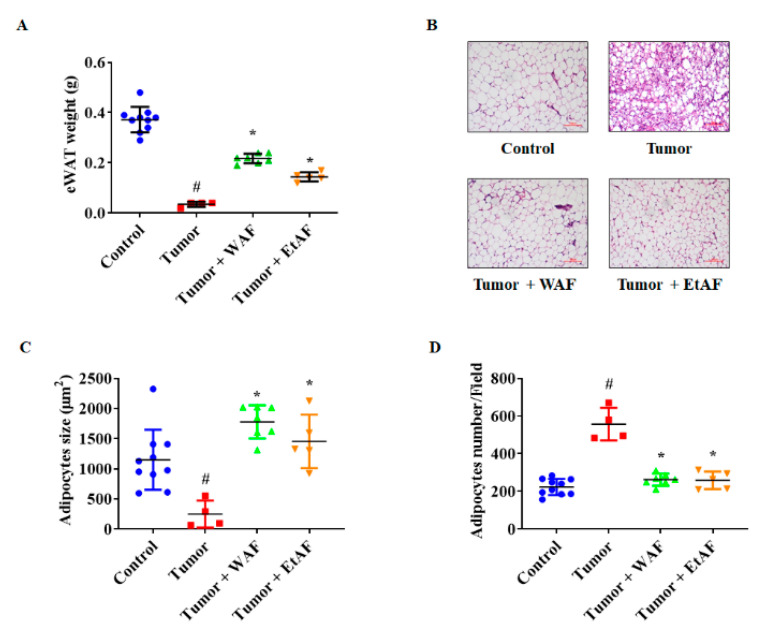
Figure 6.
Effects of AF on eWAT wasting in intraperitoneally CT-26 tumor-bearing mice. The weight of eWAT was measured after sacrificing mice (A). The H&E staining images of eWAT (B). The magnitude is ×200 and the scale bar is 100 µm. Adipocyte size was measured using ImageJ (C). The adipocyte number of each group was counted by randomly selecting fields (D). All values are mean ± SD. # p < 0.05, significantly different from control group; * p < 0.05, significantly different from tumor group.

