
Figure 2. Gene set enrichment analysis and target gene expression.
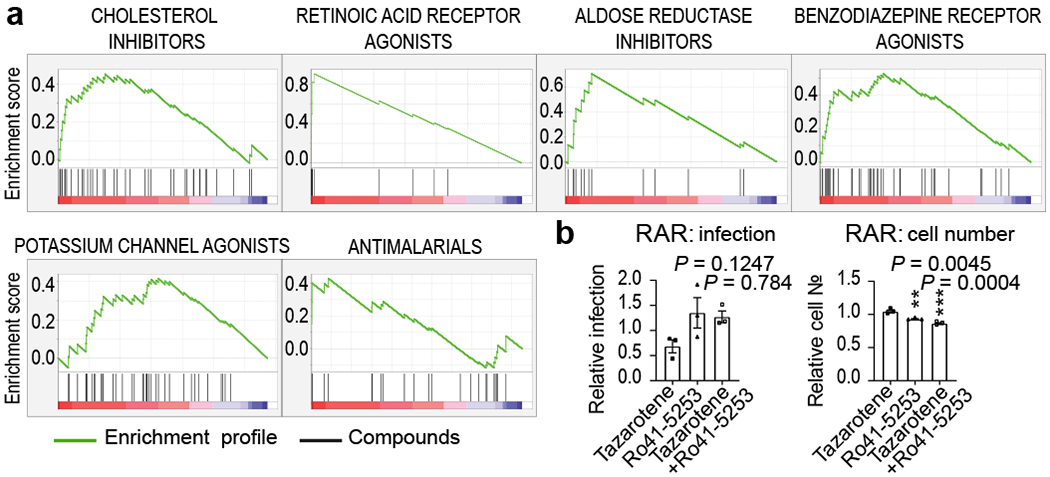
(a) Enriched targets and mechanisms of action of potential antiviral compounds were determined through Gene Set Enrichment Analysis (GSEA). GSEA enrichment plots provide the distribution of the enrichment score (green line) across compounds that were annotated to molecular targets, ranked in order of antiviral activities (left to right). Vertical black lines reflect the positioning of each compound within a specific target class across the ranked dataset, where again, the leftmost position indicates most potent antiviral activity (red), and the rightmost position indicates inactivity in the HTS screen (blue). Enriched target clusters are shown, including retinoic acid receptor agonist, benzodiazepine receptor inhibitor, aldose reductase agonist, potassium channel agonist, cholesterol inhibitor, and antimalarials (P-value < 0.05, FDR q-value < 0.33). Additional enriched target classes are shown in Figure ED2. P-values were calculated as indicated in the materials and methods. (b) Chemical epistasis analysis of Retinoic Acid Receptor Agonist Antiviral Activity. Vero E3 cells were treated with 5 μM of the RAR agonist tazarotene and challenged with SARS-CoV-2, and infection was determined as described in Figure 3. Similarly, Vero E6 cells where pretreated with 5 μM of the RAR antagonist Ro41-5253, either alone or in combination with 5 μM of tazarotene (left panel). Cellular toxicity was measured through enumeration of cell numbers (right panel). Data are normalized to the average of DMSO-treated wells and represent mean ± SEM for n=3 independent experiments. One-way ANOVA followed by Dunnett post-test was performed as statistical analysis. ** P ≤ 0.01, *** P ≤ 0.001.