
Figure 3. Dose-response relationships of selected antiviral compounds and synergy with remdesivir.
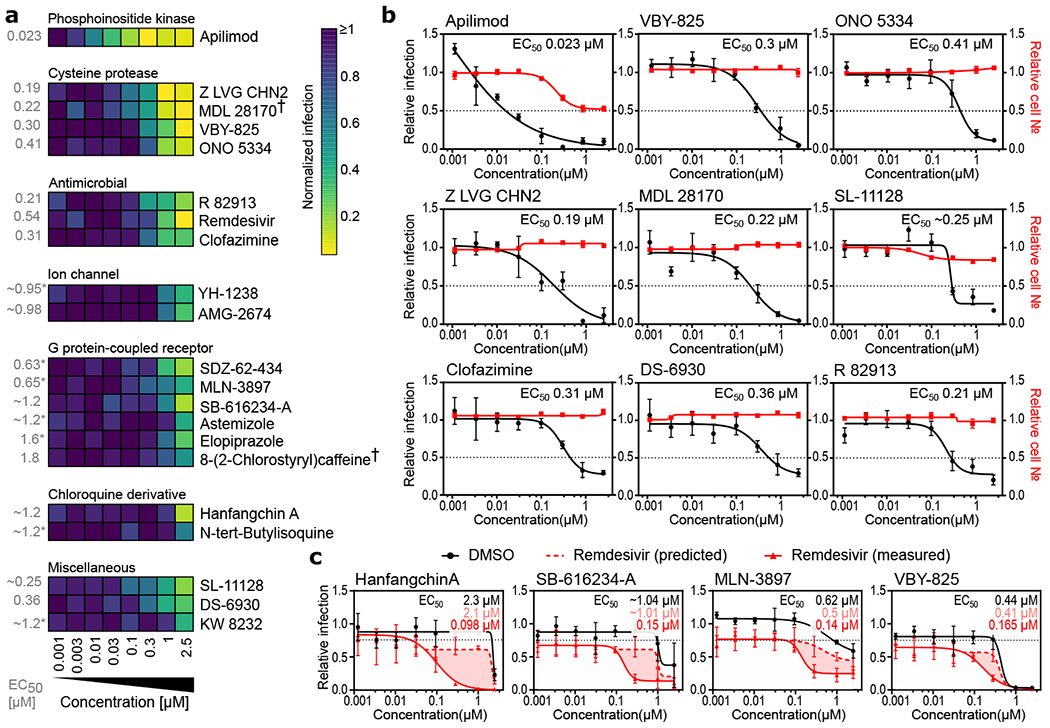
(a-c) Vero E6 cells were pre-treated for 16 h with increasing concentrations of the indicated compound and then infected with SARS-CoV-2 at MOI = 0.01. 24 h post-infection, cells were fixed, and immunofluorescence imaging was performed. For each condition, the percentage of infection was calculated as the ratio between the number of infected cells stained for CoV NP and the total amount of cells stained with DAPI. (a) Heatmap representing normalized infection of the indicated 21 compounds in dose-response, on a scale from 0 to 1, depicting the average of n=5 independent experiments. Compounds are grouped in predicted function clusters. † concentration of 0.85 μM instead of 1 μM at the second highest dose. Extrapolated EC50 values are listed on the left of the heatmap. (b) Dose-response analysis of most potent compounds in (a) are shown, depicting both infectivity (black), cell number (red), and cellular EC50 values (also see ED6). (c) Compounds at indicated doses were combined with 800 nM remdesivir or a negative control (DMSO), and antiviral dose response relationships were determined in Vero E6 cells using experimental conditions described in (b). 800 nM remdesivir alone inhibited viral infection by 20 % (black dotted line). Predicted additive combinatorial activity of remdesvir and indicated compound (see materials and methods) is denoted by red dotted line. Observed activity of remdesivir in combination with the indicated compound is shown with a solid red line, and shaded portions of graph indicate differential of predicted and observed combinatorial activities. EC50s for compound alone (black lettering), predicted (pink lettering), and observed (red lettering) are also presented. Data are normalized to the average of DMSO-treated wells and represent mean ± SEM for n=3 (apilimod, MDL 28170, Z LVG CHN2, VBY-825, and SL-11128) (b,c) and n=5 (ONO 5334 ,clofazimine, DS-6930 and R82913) (b) independent experiments. * indicates compounds for which EC50 values were calculated based on observed values at the highest concentrations.