
Figure 5. Assessment of antiviral activity in human cell models.
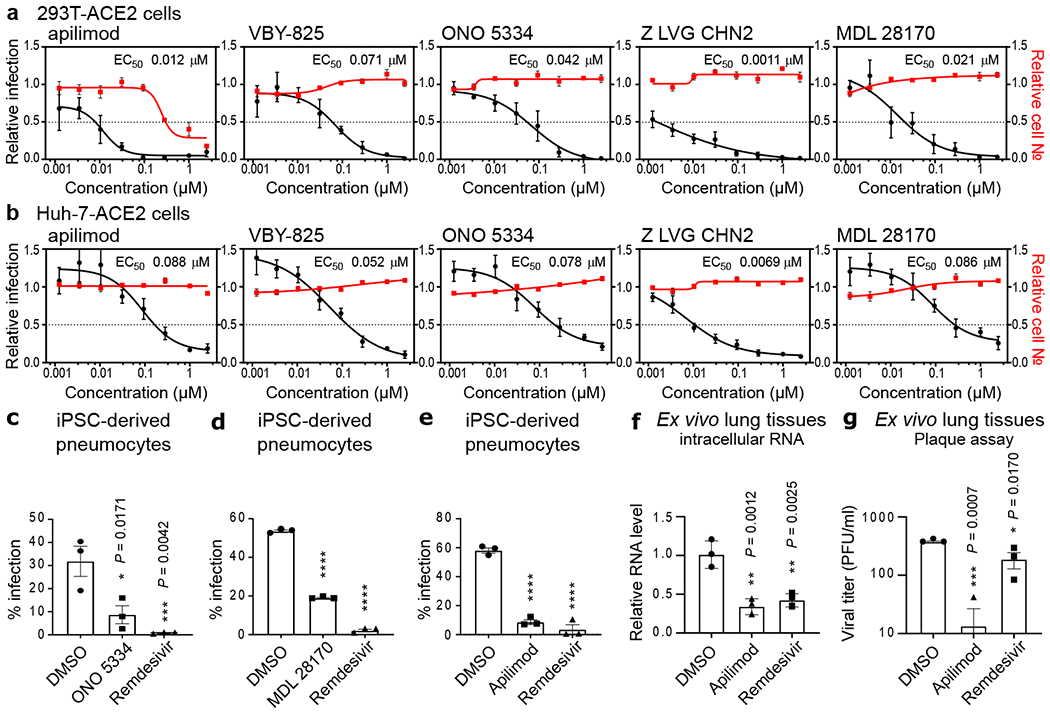
HEK-293T (a) and Huh-7 cells (b) transduced with ACE2 were pre-treated for 16 h with increasing concentrations of the indicated compound and then infected with SARS-CoV-2 (MOI = 0.3). 24 h post-infection, cells were fixed, and immunostained, and imaged by immunofluorescent microscopy. For each condition, the percentage of infection was calculated as the ratio between the number of infected cells stained for CoV NP and the total amount of cells stained with DAPI. Compound concentrations ranged between 1 nM and 2.5 μM. Dose-response curves for infectivity (black) and cell number (red) are shown. Data are normalized to the average of DMSO-treated wells and represent mean ± SEM for n=4 independent experiments. EC50 for each compound was calculated as 4-parameter logistic non-linear regression model and is indicated. (c-e) iPSC-derived pneumocytes were incubated with 5 μM of the indicated compound two hours prior to infection, and then infected with 105 pfu of SARS-CoV-2. Two days post infection, cells were harvested, and viral infection was quantified by flow-cytometry (Cov NP staining). Data represent mean ± SEM for n=3 biological replicates. One-way ANOVA followed by Dunnett post-test was performed as statistical analysis. (f-g) Ex vivo lung tissues were infected with SARS-CoV-2 with an inoculum of 5×10⁵ PFU. After two hours, the inoculum was removed, and the indicated compound was added at a 5 μM concentration. 24 hours post-infection, supernatants were collected for quantification of viral titer by plaque assay (f) and cells harvested for quantification of intracellular viral RNA (g). Error bars represent SEM for n=3 biological replicates. One-way ANOVA followed by Dunnett post-test was performed as statistical analysis. * P ≤ 0.05, ** P ≤ 0.01, *** P ≤ 0.001, **** P ≤ 0.0001.