
Figure ED1. High-throughput repositioning screens for SARS-CoV-2 antivirals.
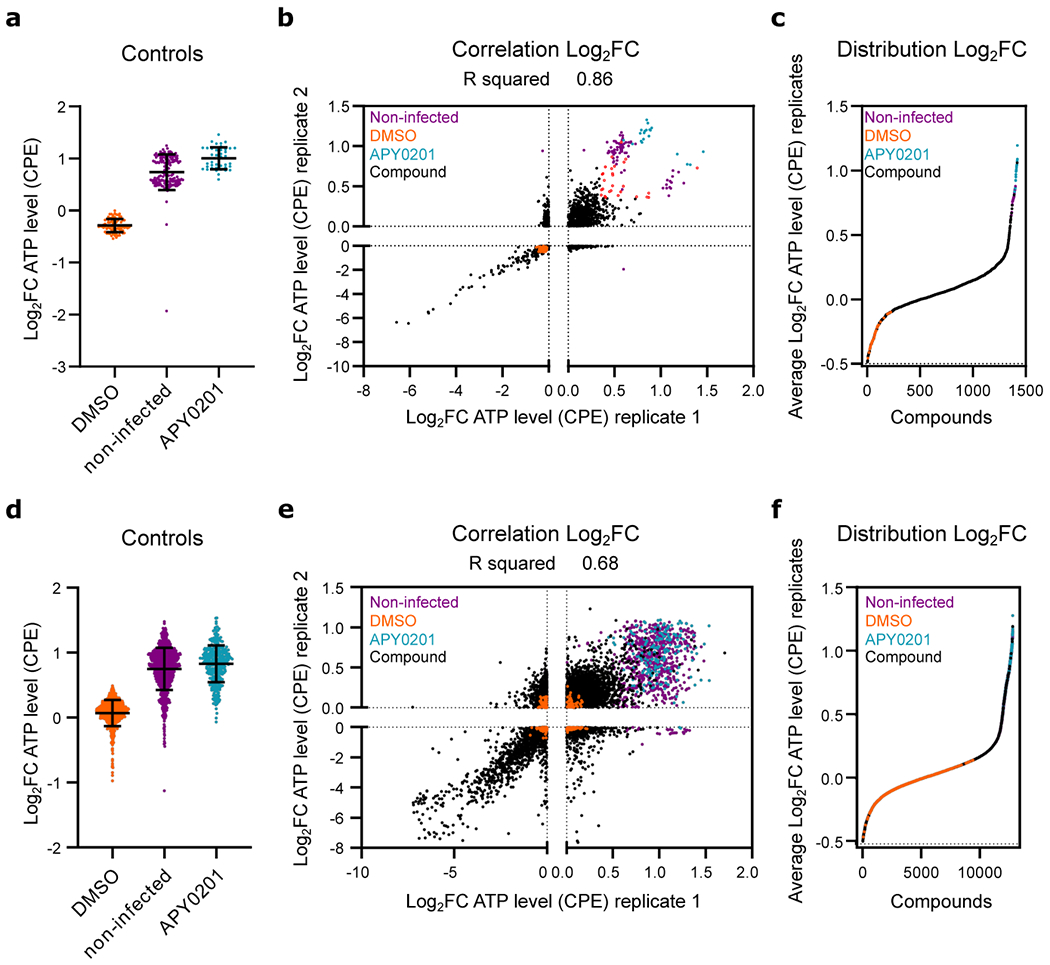
(a-c) Data from preliminary LOPAC®1280 library primary screen. (d-f) Data from ReFRAME collection screen. (a, d) Log2 fold change (Log2FC) of ATP levels after normalization to the median of each plate for SARS-CoV-2 infected all positive (APY0201) and negative (DMSO) controls, as well as for non-infected cells, across all screening plates. Error bars represent mean ± SD for at least n=40 and n=376 (d) independent wells. (b, e) Correlation plot indicating the Log2FC of each compound of two replicate screens. (c, f) Distribution of activities for each compound according to the average of the log2FC of each replicate. Each datapoint indicates the Log2FC average of each drug in screen (black dots). Values corresponding to DMSO (orange dots), APY0201 (cyan dots) and non-infected cells (purple dots) are also represented. Red circles indicate the activities of selected compounds chosen for follow-up for the LOPAC®1280 screens. R squared value indicates the linear correlation coefficient for the replicates of LOPAC®1280 (b) and ReFRAME (e) screens.