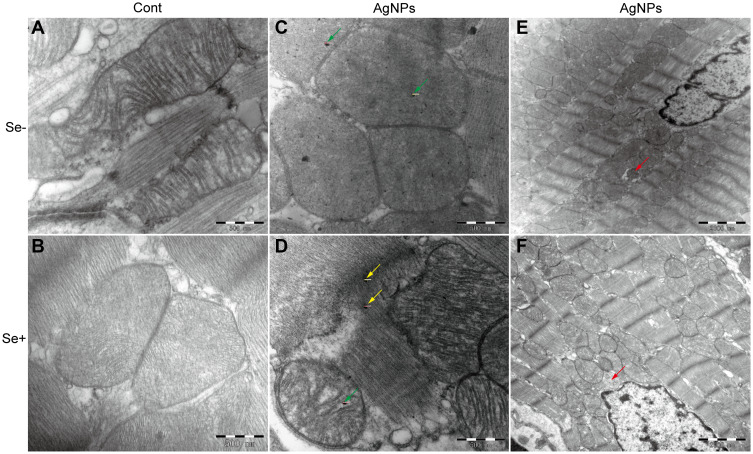
Figure 5.
Ultrastructural changes of mitochondrial morphology and the mitophagy. (A–D) representative images showing mitochondrial morphology from (A) control, (B) Se-treated, (C) AgNPs-treated and (D) Se+AgNPs cotreated group; Green arrows denote silver nanoparticles within the mitochondria and yellow for outside. (E and F) representative images showing mitophagy in (E) AgNPs-treated and (F) Se+AgNPs cotreated group. Red arrows denote mitophagy.
Abbreviations: Cont, control; AgNPs, silver nanoparticles; Se, selenium.

