
Fig. 2. Cutaneous MAIT cells express a type-17 transcriptional program and require homeostatic IL-23.
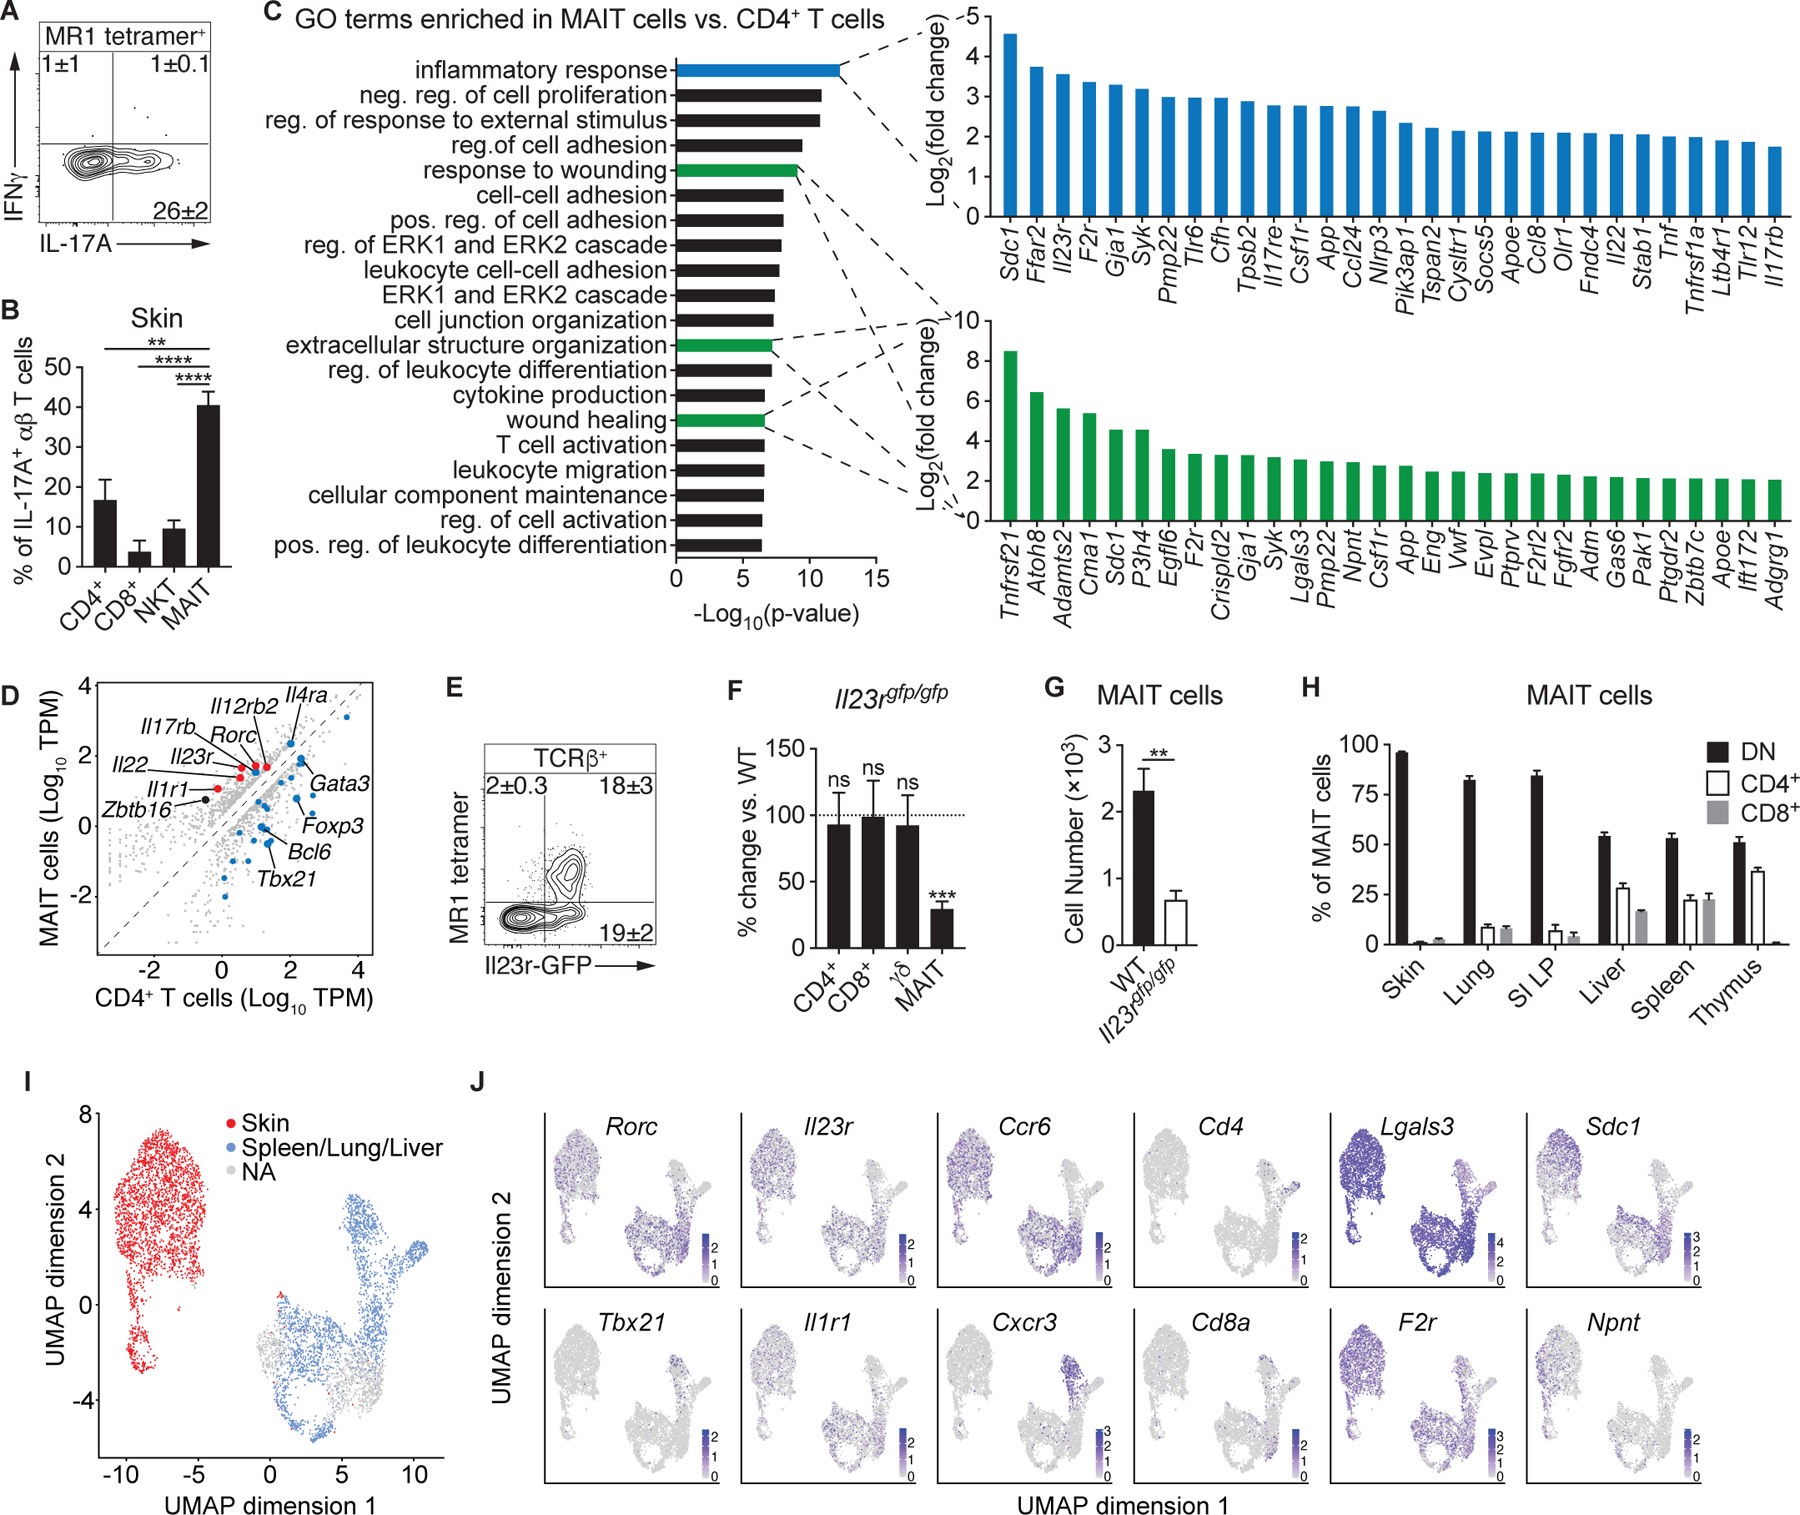
(A) Flow cytometry of cytokine production by MAIT cells from the skin of WT mice. (B) Percentage of IL-17A+ αβ T cells within WT murine skin that were CD4+, CD8+, NKT, or MAIT cells. (C-D) RNA-sequencing (RNA-seq) data of cutaneous MAIT cells and CD4+ CD25− T cells. (C) Top 20 gene ontology (GO) terms that were enriched in MAIT cells and, for the indicated GO terms, the top 30 genes upregulated in MAIT cells. Positive (pos.), negative (neg.), and regulation (reg.) are abbreviated. (D) Expression plot normalized to transcripts per million (TPM), with a minimum fold change of 2 and FDR < 5%. Type-17 genes are denoted in red and genes associated with Type-1, Type-2, T regulatory, and T helper programs are highlighted in blue. (E) Representative flow cytometry plot of TCRβ+ lymphocytes from the skin of Il23rgfp/+ mice. (F) Percentage change of the indicated T cells in the skin of Il23rgfp/gfp mice compared to WT controls. Statistics denote whether the percentage differs significantly from the WT mean (100%). (G) Number of cutaneous MAIT cells in Il23rgfp/gfp mice and WT controls. (H) Percentage of MAIT cells in the indicated organs that expressed CD4, CD8, or neither coreceptor (double negative; DN). (I-J) Single-cell RNA-seq (scRNA-seq) data of MAIT cells sorted from murine skin, spleen, lung, and liver. Clusters were assigned to “Skin” or “Spleen/Lung/Liver” based on the presence of hashtag oligonucleotides (HTOs) from those tissues. Clusters that did not have a predominance of HTOs from either skin or the other tissues were not assigned (“NA”). (I) UMAP plot displaying the distribution of MAIT cell clusters assigned to skin and the other tissues. (J) UMAP plots depicting expression of the indicated transcripts. Flow cytometry gate frequencies and graphs indicate means ± SEM. Data represent at least two experiments with four or more mice per group. **p<0.01, ***p<0.001, and ****p<0.0001 as calculated by Student’s t-test. “ns” denotes that comparison was not significant.