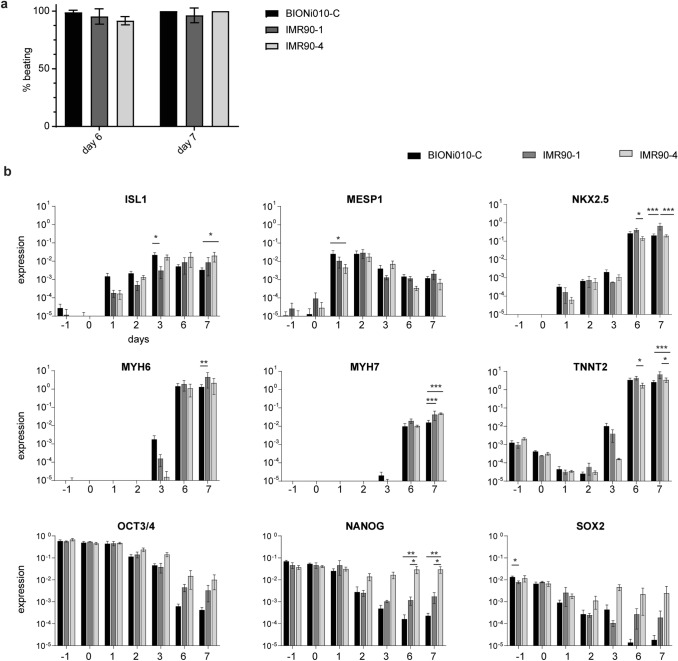
Fig. 3.
Differentiation efficiency and gene expression analysis for three cell lines. a All three cell lines (BIONi010-C, IMR90-1, and IMR90-4) were differentiated into cardiomyocytes and beating embryoid bodies (EBs) counted on day 6 and day 7. Thirty-two EBs were counted per experiment. Shown in percent of all counted EBs, mean and SEM of three differentiation experiments with each cell line. b All three cell lines (BIONi010-C, IMR90-1, and IMR90-4) were differentiated into cardiomyocytes and samples taken every day of differentiation. Mean and SEM of ≥ 2 differentiation experiments for each cell line. Stars indicate significant differences between cell lines calculated with a two-way ANOVA. Columns without stars do not differ significantly. n = 4 (BIONi010-C), n = 2 (IMR90-1 and IMR90-4)

