
Fig. 3.
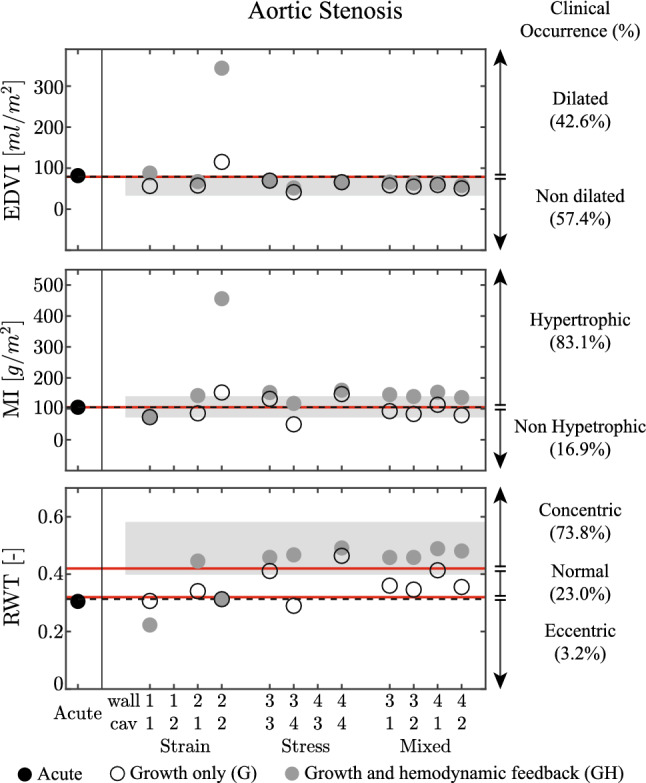
Aortic stenosis (AS) case for the acute state (Acute), the growth only cases (G) and the cases with growth and hemodynamic feedback (GH). Results are grouped by a strain stimulus only, a stress stimulus only, and a mixed stimulus of both stress and strain. For ease of notation, on the horizontal axis the four stimuli are denoted by: (1) sarcomere strain amplitude , (2) maximum strain , (3) average sarcomere stress and (4) maximum stress , see also Tab. (1). The figure shows the left ventricular end diastolic volume index (EDVI), mass index (MI) and relative wall thickness (RWT). On the three panels, patient data are presented as mean with standard deviation (Guzzetti et al. 2019), while on the right side patient data are represented as clinical occurrence in percentage (Barbieri et al. 2019a). The left ventricle is considered dilated if EDVI > 79 ml/, hypertrophic if MI > 105 g/, and with an eccentric geometry, with RWT < 0.32, normal geometry, with 0.32 RWT 0.42, and concentric geometry, with RWT > 0.42 (Gaasch and Zile 2011). The dashed lines identify the homeostatic level