
Fig. 5.
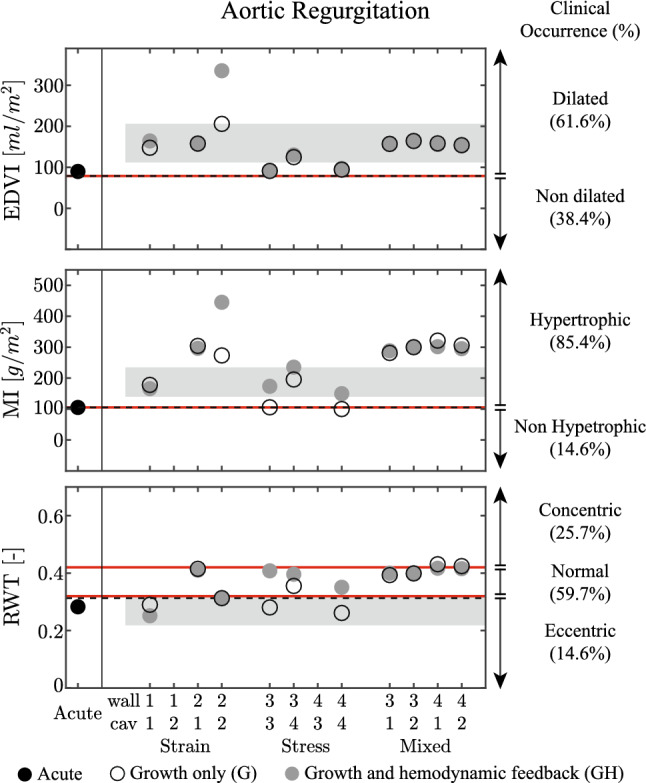
Results for the aortic regurgitation (AR) case, presented according to the format in Fig. 3. On the three panels, patient data are identified as mean with standard deviation, with data collected from Wisenbaugh et al. 1984 for end diastolic volume EDVI and mass index MI while Seldrum et al. (2018) is used for relative wall thickness RWT. On the right side, patient data are represented as clinical occurrence in percentage (Barbieri et al. 2019b)