Fig. 2.

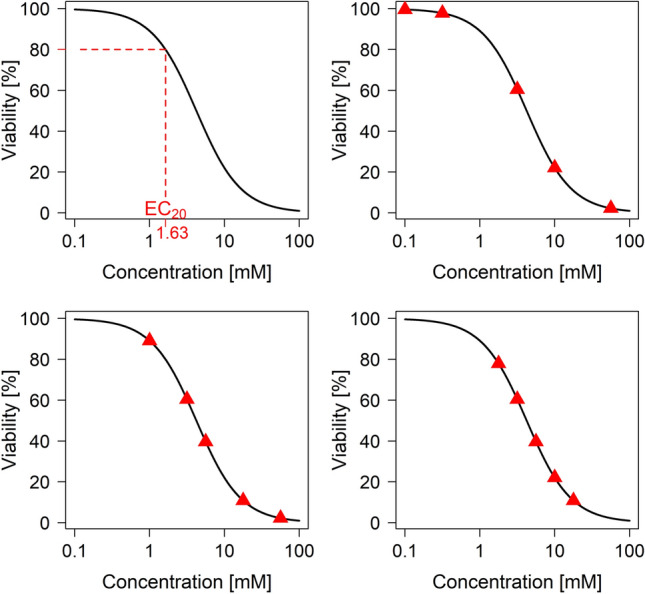
Underlying sigmoidal curve of the simulation study with true EC value (top left), and selected concentrations (denoted as red triangles) for the three situations ”easy” (top right), ”medium” (bottom left) and ”difficult” (bottom right)

Underlying sigmoidal curve of the simulation study with true EC value (top left), and selected concentrations (denoted as red triangles) for the three situations ”easy” (top right), ”medium” (bottom left) and ”difficult” (bottom right)