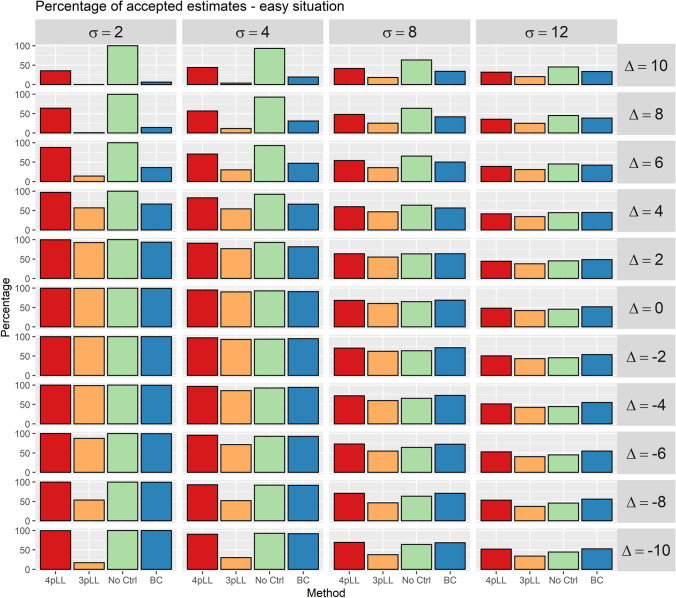
Fig. 4.
Percentages of accepted estimates for the 5000 iterations of the simulation study. In the situation shown here, the five concentrations considered cover the entire range of the curve (”easy” situation). An estimate is accepted if it takes values in the interval [1.25, 2.12]. Each cell corresponds to one combination of the standard deviation of the replicates, , and the deviation of the controls, . In each cell, percentages for all four methods (from left to right: 4pLL, 3pLL, NoCtrl, BC) are shown. The columns represent standard deviations (increasing from left to right) and rows deviations of the controls (positive deviations on top, no deviations in the center and negative deviations in the bottom)

