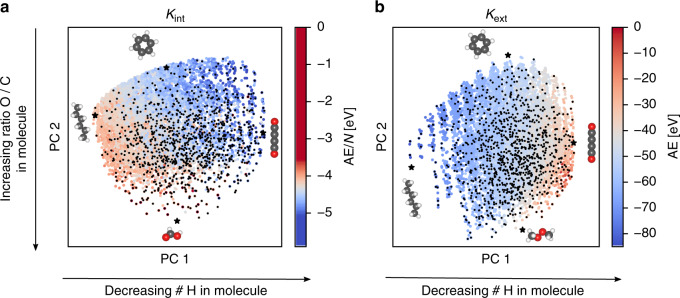
Fig. 3. Visualizing Rad-6 with Kernel Principal Component Analysis (kPCA).
a kPCA based on an intensive kernel. b kPCA based on an extensive kernel. Points are colored according to the DFT atomization energy per atom in (a) and total atomization energy in (b). The arrows provide a qualitative interpretation of the principal component (PC) axes and small black dots indicate the FPS-selected training configurations for a ML model with 1000 training molecules and using the corresponding distance criterion (Dint (a), Dext (b)), see text.

