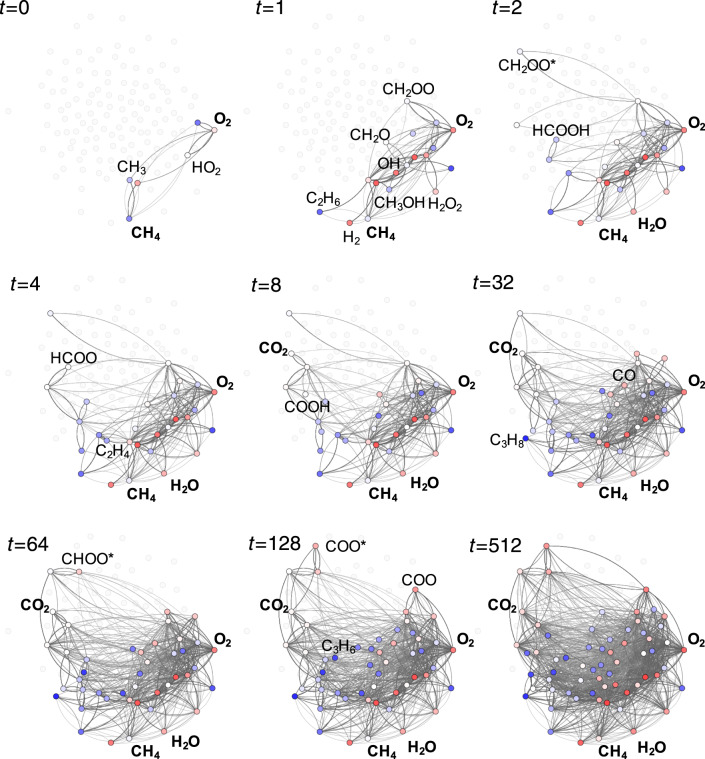
Fig. 7. ML-based exploration of a complex reaction network.
Each frame shows the reduced reaction network extracted from a microkinetic simulation of methane combustion at different stages in simulation time. The abstract simulation time is shown for each frame in arbitrary units, see text. Educts and products (in bold), as well as important intermediates are highlighted. Nodes are colored according to their absolute atomization energies from low (red) to high (blue). Cyclic compounds are marked with an asterisk, to distinguish them from the corresponding linear compounds.

