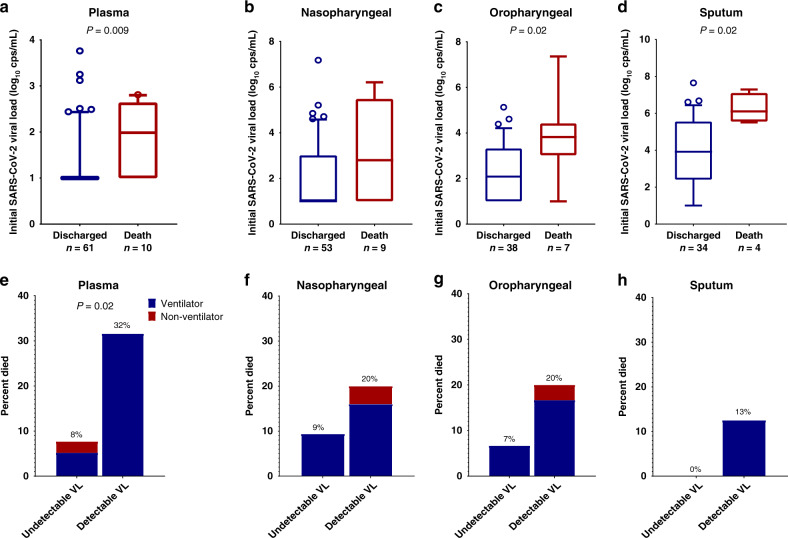
Fig. 3. SARS-CoV-2 viral load and risk of death.
a–d Participants who died had higher initial viral loads compared to those who survived to discharge. The center line depicts the median value, the whiskers depict the 10–90 percentile. P values are from a two-tailed Wilcoxon rank sum test. e–h Percent of participants who eventually died categorized by detectable viral load and disease severity at the time of initial sampling. VL viral load, cps copies. P values are from a two-tailed Fishers exact test.

