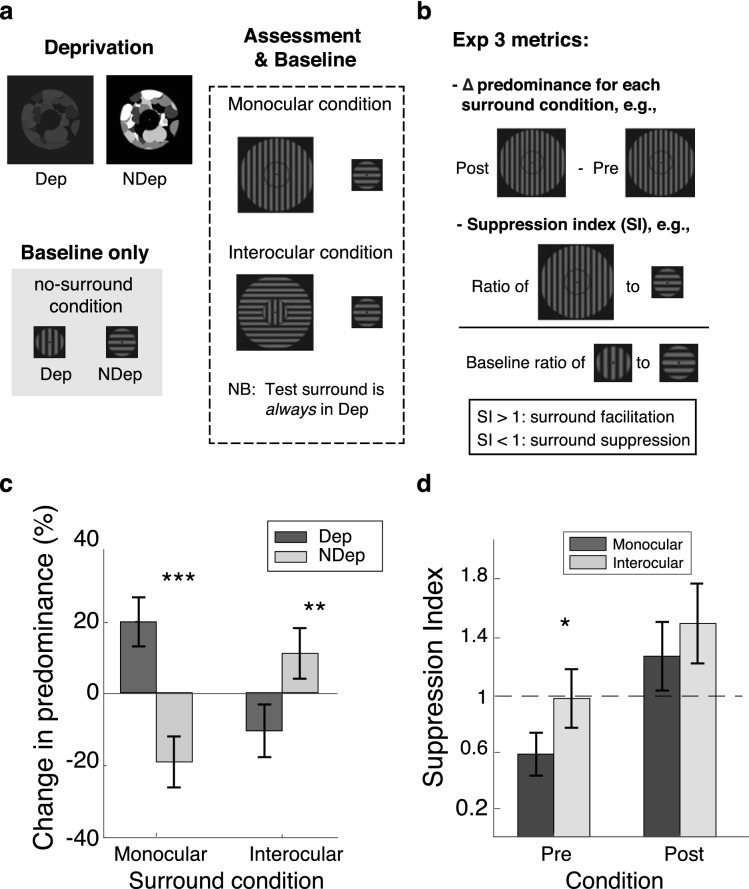
Figure 3.
Experimental details and results of Experiment 3. (a) Stimulus presentation. All visual stimuli were presented in central vision, varying only in the type of experimental condition. Given the spatially specific result in Experiment 1, no-surround conditions were only assessed at baseline. Monocular and interocular surround conditions were assessed before and after deprivation. (b) Metrics used to evaluate the effect of monocular deprivation on surround suppression. (c) Effect of deprivation on the change in predominance for each surround condition. When the test surround matched the central target of the deprived eye (monocular condition), the predominance of the deprived eye increased and the predominance of the non-deprived eye decreased (standard DE). In contrast, the opposite trend was observed when the test surround matched the central target of the non-deprived eye. (d) Effect of deprivation on the suppression index. Pre-deprivation, suppression indices were less than 1, indicating surround suppression. The magnitude of suppression, however, was larger in the monocular condition. Post-deprivation, indices for both surround conditions were larger than 1, indicating surround facilitation. Error bars are the 95% confidence intervals and central tendencies are represented by the group mean. Asterisks represented significance level (p < 0.05: *, p < 0.01: **, p < 0.001: ***).

